Median - Measures of Central Tendency, Business Mathematics & Statistics | SSC CGL Tier 2 - Study Material, Online Tests, Previous Year PDF Download

MEDIAN :
Definition If a set of observation are arranged in order of magnitude (ascending or descending), then the middle most or central value gives the median. Median divides the observations into two equal parts, in such a way that the number of observations smaller than median is equal to the number greater than it. It is not affected by extremely large or small observation. Median is, thus an average of position. In certain sense, it is the real measure of central tendency.
So Median is the middlemost value of all the observations when they are arranged in ascending order of magnitudes.
Calculation of Median : (A) For simple data or Series of Individual Observations :
Individual observations are those observations (or variates) having no frequencies or frequency is unit every case.
At first, the numbers are to arranged in order of magnitude (ascending or descending). Now for n (the total number of items) odd.
Median = value of  item and for n even
Median = average value  th item and
  th item.
or, median = value ofth item (n = odd or even)
[Note : item gives the location of median, but not its magnitude]
Steps to calculate Median 1. Arrange the data in ascending or descending order. 2. Find n (odd or even). 3. Apply usual formula and calculate.
Example 25 : To find the median of the following marks obtained by 7 students : 4, 12, 7, 9, 14, 17, 16.
(i) Arrangement of marks : 4, 7, 9, 12, 14, 16, 17.
(ii) n = 7 = an odd number
(iii) Median = value of th item = value of  item = value of 4 th item = 12 (from the arranged data
∴ median is 12 marks.
[Note : Unit of the result will be same as given in original variate.]
Example 26 : To find the median of marks : 4, 12, 7, 9, 14, 17, 16, 21
(i) Arrangement : 4, 7, 9, 12, 14, 16, 17, 21. (ii) n = 8 = an even number
(iii) Median = average value of n/2 th item and th i.e.
= average value of 8/2 th item and the next item
= average value of 4th item and the 5th item
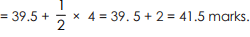
= average value of 12 and 14 marks = 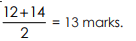
Alternative
way Median = value of th item = value of  h item = value 4.5th item = 1/2 (value of 4th item and value of 5th item)
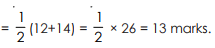
(B) For Direct Series (or simple Frequency Distribution) Cumulative frequency (less than type) is calculated. Now the value of the variable corresponding to the cumulative frequencygives the median, when N is the total frequency.
Example 27 : To find the median of the following
x : 1 2 3 4 5 6
y : 7 12 17 19 21 24
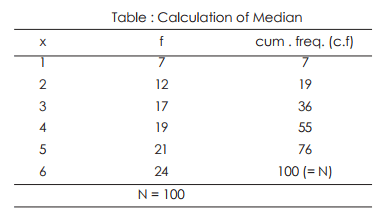
Now, median = value of t th item = value of  item = value of 50.5th item.
From the last column, it is found 50.5 is greater than the cumulative frequency 36, but less than the next cum. Freq. 55 corresponding to x = 4. All the 19 items (from 37, to 55) have the same variate 4. And 50.5 item is also one of those 19 item.
∴ Median = 4.
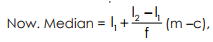
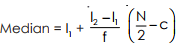
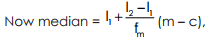
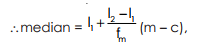
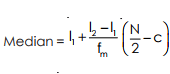
(C) For Continuous Series (Grouped Frequency Distribution) We are to determine the particular class in which the value of the median lies. by using the formula n/2 (and not by  , as in continuous series N/2 divides the area of the curve into two equal parts). After locating median, its magnitude is measured by applying the formula interpolation given below:
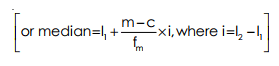
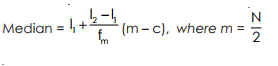
Where l1 = lower limit of the class in which median lies,
l2 = Lower limit of the class in which median lies.
fm = the frequency of the class in which median falls.
m = middle item (i.e., item at which median is located or N/2 th item).
C = cumulative frequency less than type of the class preceding the median class,
[Note : The above formula is based on the assumption that the frequencies of the class-interval in which median lies are uniformly distributed over the entire class-intrerval]
Remember : In calculating median for a group frequency distribution, the class-intervals must be in continuous forms. If the class-intervals are given in discrete forms. They are to be converted first into continuous or class-boundaries form and hence to calculate median, apply usual formula.
Example 28 : Find the median and median-class of the data given below :––
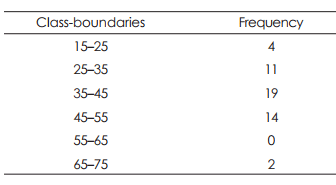
Solution :
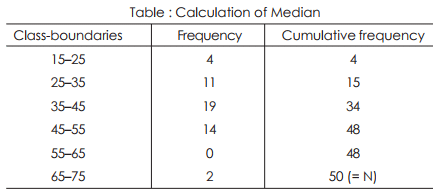
Median = value of th Nth/2 item = value of th 50th/2 item = value of 25th item, which is greater than cum. Freq. 15. So median lies in the class 35–45.
 where l 1 = 35, l 2 = 45, f = 19, m = 25, c = 15 where l 1 = 35, l 2 = 45, f = 19, m = 25, c = 15 |
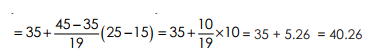
required median is 40.26 and median-class is (35 – 45).
Example 29: Calculate the median of the table given below :
Class interval : 0–10 10–20 20–30 30–40 40–50
Frequency : 5 4 6 3 2
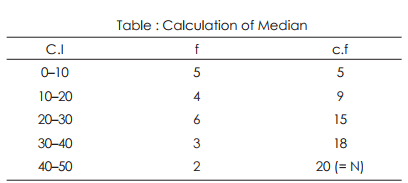
median = value of th Nth/2 term = value of 20/2 (=10)th term, median class is (20–30).
Calculation of Median from Discrete Grouped Distribution
If the class intervals of grouped frequency distribution are in discrete form, at first they are to be converted into class-boundaries and hence to find median by applying usual formula. The idea will be clear from the following example.
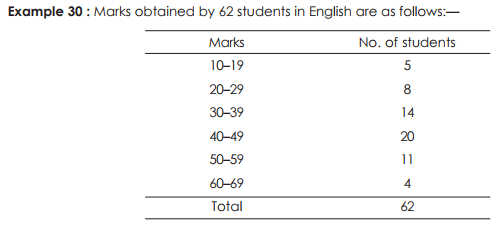
Compute median class and median.
Solution :
The class intervals are in discrete form. They are to be converted to class boundaries first, which is shown below :
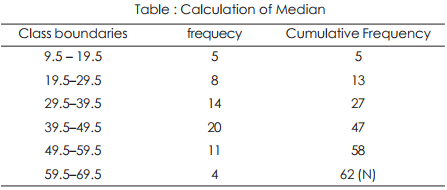
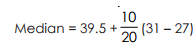
Median = value of th Nth/2 term = values of th 62th/2 term or value of 31st term
∴ Median lies in (39.5 – 49.5)
 here l 1 = 39.5, l 2 = 49.5, fm = 20, m = 31, c = 27 here l 1 = 39.5, l 2 = 49.5, fm = 20, m = 31, c = 27 |
  |
Calculation of median from cumulative frequency distribution
In this case at first cumulative frequency is to be converted into general group frequency distribution. Then applying usual formula median is to be calculated.
Example 31 :
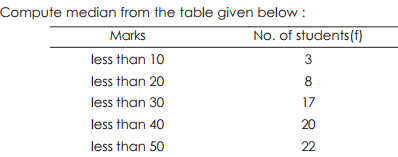
Solution : The general group frequency distribution is as follows : ––
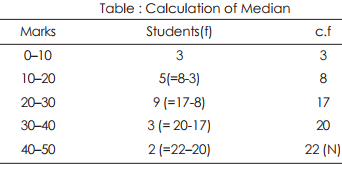
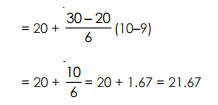
median = value of th Nth/2 term = value of th 22th/2 term = value of 11th term
∴median class is ( 20 – 30)
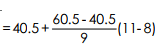
= 20 + 10/9 (11 – 8), here l1 = 20 l 2 = 30, fm = 9, m = 11, c = 8
= 20 + 10/9 = 20 + 3.33 = 23.33 marks
Note : If the cumulative frequency distribution is given in ‘more than type’ form then also the same procedure is to be followed.
Example 32 : Calculate the median of the frequency distributions
Marks : 1–20 21–40 41–60 61–80 81–100
No. of students : 3 5 9 3 2
Solution : The class intervals: are in discrete forms, so they are to be made in class boundaries at first
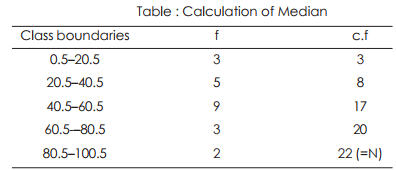
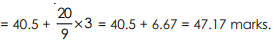
Median = value of 22th/2 th term = values of 11th term ∴ Median class is (40.5 – 60.5)
  |
Calculation of median from open ends class intervals :
Since the first and last class intervals are not required in computing median, so in case of open end classintervals median is calculated by usual process. For example, in the above example it the lower-limit of first class interval (i.e.0) and upper limit of last class (i.e. 5) are not given question, there would be no difficulty to compute median. In case of open end class-intervals, median is preferred than A.M. as average
Finding of missing frequency
The idea of finding missing frequency will be clear from the following example
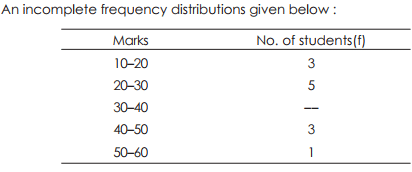
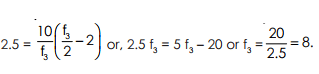
It is given that median of the above distribution is 32.5 marks. Find the missing frequency
Solution :
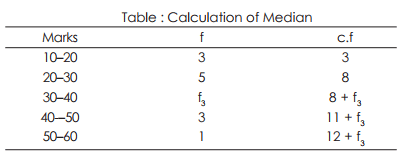
Here Median = 32.5 (given), so median class is (30–40).
Let f3 be the missing frequency, 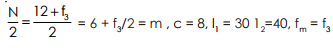
From the formula, 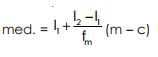
We get, 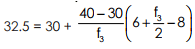
Advantages of Median :
(i) The median, unlike the mean, is unaffected by the extreme values of the variable.
(ii) It is easy to calculate and simple to understand, particularly in a series of individual observations a discrete series.
(iii) It is capable of further algebraic treatment. It is used in calculating mean deviation.
(iv) It can be located by inspection, after arranging the data in order of magnitude.
(v) Median can be calculated even if the items at the extreme are not known, but if we know the central items and the total number of items.
(vi) It can be determined graphically.
Disadvantage of Median :
(i) For calculation, it is necessary to arrange the data; other averages do not need any such arrangement.
(ii) It is amenable to algebraic treatment in a limited sense, Median cannot be used to calculate the combined median of two or more groups, like mean.
(iii) It cannot be computed precisely when it lies between two items.
(iv) Process involved to calculate median in case of continuous series is difficult to follow.
(v) Median is affected more by sampling fluctuations than the mean.
|
1334 videos|1437 docs|834 tests
|
FAQs on Median - Measures of Central Tendency, Business Mathematics & Statistics - SSC CGL Tier 2 - Study Material, Online Tests, Previous Year
| 1. What is the median in statistics? |  |
| 2. How do you find the median of a set of numbers? | |
| 3. What is the significance of the median in data analysis? | |
| 4. When should I use the median instead of the mean? | |
| 5. Can the median be used with any type of data? | |


Viva Questions
,Important questions
,Previous Year
,Free
,shortcuts and tricks
,Semester Notes
,past year papers
,Previous Year
,Extra Questions
,Median - Measures of Central Tendency
,Previous Year Questions with Solutions
,MCQs
,practice quizzes
,Online Tests
,Business Mathematics & Statistics | SSC CGL Tier 2 - Study Material
,Median - Measures of Central Tendency
,study material
,Median - Measures of Central Tendency
,Online Tests
,ppt
,Objective type Questions
,video lectures
,Previous Year
,Summary
,Exam
,Business Mathematics & Statistics | SSC CGL Tier 2 - Study Material
,Sample Paper
,Online Tests
,mock tests for examination
,Business Mathematics & Statistics | SSC CGL Tier 2 - Study Material
;


Median - Measures of Central Tendency, Business Mathematics & Statistics Free PDF Download
Importance of Median - Measures of Central Tendency, Business Mathematics & Statistics
Median - Measures of Central Tendency, Business Mathematics & Statistics Notes
Median - Measures of Central Tendency, Business Mathematics & Statistics SSC CGL Questions
Study Median - Measures of Central Tendency, Business Mathematics & Statistics on the App
|
© EduRev
|
Education Revolution
|


|


within 7 days!