Moments - Measures of Dispersion, Business Mathematics & Statistics | SSC CGL Tier 2 - Study Material, Online Tests, Previous Year PDF Download

- Moments
A moment designates the power to which deviation are raised before averaging them.
Methods of Standard Deviation
1. Moments about Mean or Central Moments
2. Moments about Origin or Zero
3. Moments about Provisional Mean or Arbitrary Value (Non Central Moment)
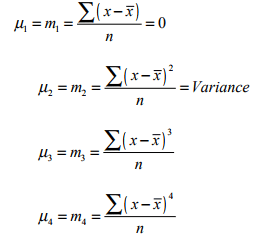
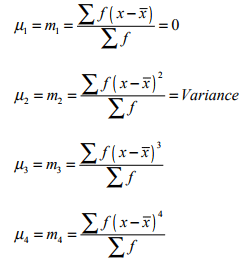
1. Moments about Mean or Central Moments
For Ungrouped Data
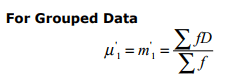
For Grouped Data
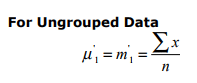
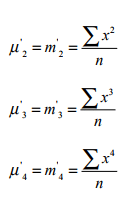
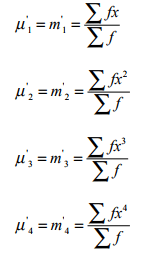
2. Moments about Origin or Zero
For Grouped Data
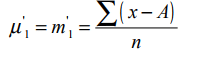
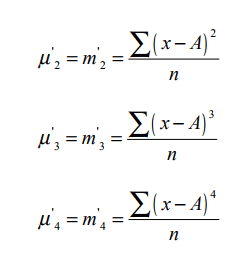
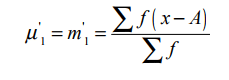
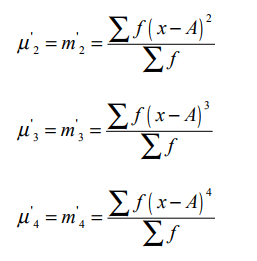
3. Moments about Provisional Mean or Arbitrary Value (Non Central Moment)
4. Methods of Standard Deviation
i. Direct Method
ii. Short Cut Method
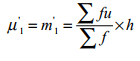
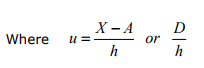
iii. Coding Method or Step-Deviation Method
i. Direct Method For Ungrouped Data
For Ungrouped Data
 Where A is constant
For Grouped Data
 Where A is constant
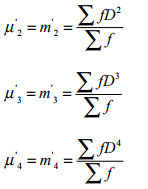
ii. Short Cut Method
For Ungrouped Data
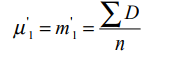 Where D= X - A
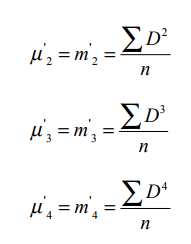
 Where D= X - A
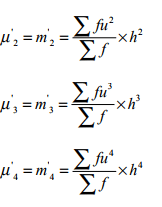
iii. Coding Method or Step Deviation Method
For Ungrouped Data
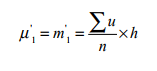
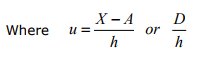
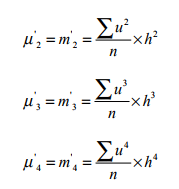
For Grouped Data
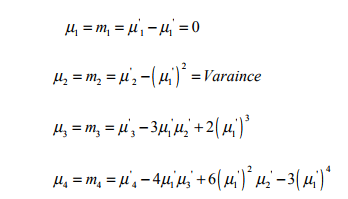
- Relation Between Central moments in Terms of Non Central Moments
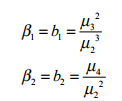
- Moments – Ration
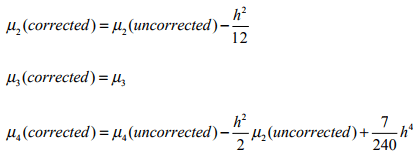
• Sheppard’s Correction for Moments of Group Data
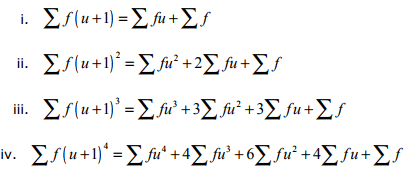
• Charliers Check
- Symmetry
In a symmetrical distribution a deviation below the mean exactly equals the corresponding deviation above the mean. It is called symmetry. For symmetrical distribution the following relations hold.
Mean = Median = Mode
Q3 - Median = Median - Q1
u3 = m3 = 0
β1 = b1 = 0
- Skewness
Skewness is the lack of symmetry in a distribution around some central value i.e. means Median or Mode. It is the degree of asymmetry.
Mean ≠ Median ≠ Mode
Q3 - Median ≠ Median - Q1
u3 = m3 ≠ 0
β1 = b1 ≠ 0 There are two types of Skewness
1. Positive Skewness
If the frequency curve has a longer tail to right, the distribution is said to be positively skewed.
2. Negative Skewness
If the frequency curve has a longer tail to left, the distribution is said to negatively skewed.
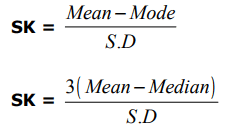
Coefficient of Skewness (SK)
Karl Pearson’s Coefficient of Skewness
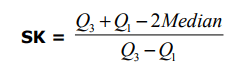
Bowly’s Quartile Coefficient of Skewness
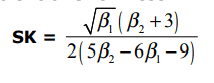
Moment Coefficient of Skewness
Kurtosis
Moment coefficient β2 is an important measure of kurtosis. These measures define as:
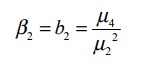
The moment coefficient β2 is a pure numbers and independent of the origin and unit of measurement.
If β2 > 3 distribution is Leptokurtic
If β2 = 3 distribution is Normal or Mesokurtic
If β2 < 3 distribution is Platy Kurtic
Or
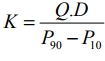 For Normal distribution, K = 0.263
|
1333 videos|1438 docs|834 tests
|
FAQs on Moments - Measures of Dispersion, Business Mathematics & Statistics - SSC CGL Tier 2 - Study Material, Online Tests, Previous Year
| 1. What are measures of dispersion in statistics? |  |
| 2. How is range calculated as a measure of dispersion? | |
| 3. What is the difference between variance and standard deviation? | |
| 4. How is the coefficient of variation useful in comparing datasets? | |
| 5. Why are measures of dispersion important in business and statistics? | |


Online Tests
,shortcuts and tricks
,Business Mathematics & Statistics | SSC CGL Tier 2 - Study Material
,Moments - Measures of Dispersion
,Extra Questions
,Business Mathematics & Statistics | SSC CGL Tier 2 - Study Material
,Moments - Measures of Dispersion
,Summary
,Objective type Questions
,Previous Year
,Previous Year
,Online Tests
,Online Tests
,Business Mathematics & Statistics | SSC CGL Tier 2 - Study Material
,video lectures
,Previous Year Questions with Solutions
,study material
,ppt
,Moments - Measures of Dispersion
,Important questions
,Previous Year
,practice quizzes
,past year papers
,Exam
,Viva Questions
,MCQs
,Free
,Semester Notes
,Sample Paper
,mock tests for examination
;


Moments - Measures of Dispersion, Business Mathematics & Statistics Free PDF Download
Importance of Moments - Measures of Dispersion, Business Mathematics & Statistics
Moments - Measures of Dispersion, Business Mathematics & Statistics Notes
Moments - Measures of Dispersion, Business Mathematics & Statistics SSC CGL Questions
Study Moments - Measures of Dispersion, Business Mathematics & Statistics on the App
|
© EduRev
|
Education Revolution
|


|


within 7 days!