NCERT Solutions for Class 10 Maths Chapter 13 - Statistics (Exercise 14.4)
NCERT TEXTBOOK QUESTIONS SOLVED
Page No. 293
EXERCISE 14.4
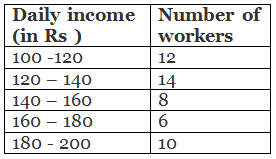
Q 1. The following distribution gives the daily income of 50 workers of a factory

Convert the distribution above to a less than type cumulative frequency distribution, and draw its ogive.
Sol. We have the cumulative frequency distribution as:
Daily income (in Rs ) | Cumulative frequencies |
Less than 120 | 12 + 0 = 12 |
Less than 140 | 12 + 14 = 26 |
Less than 160 | 26 + 8 = 34 |
Less than 180 | 34 + 6 = 40 |
Less than 200 | 40 + 10 = 50 |
Now, we plot the points corresponding to the ordered pairs (120, 12), (140, 26), (160, 34), (180, 40) and (200, 50) on a graph paper and join them by a free hand smooth curve as shown below:
The curve so obtained is called the less than o give.
Q 2. During the medical check-up of 35 students of a class, their weights were recorded as follows:
Weight (in kg) | Number of students |
Less than 38 | 0 |
Less than 40 | 3 |
Less than 42 | 5 |
Less than 44 | 9 |
Less than 46 | 14 |
Less than 48 | 28 |
Less than 50 | 32 |
Less than 52 | 35 |
Draw a less than type ogive for the given data. Hence obtain the median weight from the graph and verify the result by using the formula
Sol. Here, the values 38, 40, 42, 44, 46, 48, 50 and 52 are the upper limits of the respective class intervals.
We plot the points (ordered pairs) (38, 0), (40, 3), (42, 5), (44, 9), (46, 14), (48, 28), (50, 32) and (52, 35) on a graph paper and join them by a free hand smooth curve.
The curve so obtained is the less than type ogive.
∵ n = 35
The point 17.5 is on y-axis.
From this point (i.e., from 17.5) we draw a line parallel to the x-axis which cuts the curve at P. From this point (i.e., from P), draw a perpendicular to the x-axis, meeting the x-axis at Q. The point Q represents the median of the data which is 47.5.
Verification
To verify the result using the formula, let us make the following table in order to find median using the formula:
Weight (in kg) | Number of students [Cumulative frequency] |
0-38 | 0 |
38-40 | 3 |
40-42 | 5 |
42-44 | 9 |
44-46 | 14 |
46-48 | 28 |
48-50 | 32 |
50-52 | 35 |
Here,
Since, this observation lies in the class 46 − 48.
∴ The median class is 46 − 48 such that l = 46, h = 2, f = 14, cf = 14
Thus, the median = 46.5 kg is approximately verified.
Q 3. The following table gives production yield per hectare of wheat of 100 farms of a village.
Production yield (in kg/ha) | 50-55 | 55-60 | 60-65 | 65-70 | 70-75 | 75-80 |
Number of farms | 2 | 8 | 12 | 24 | 38 | 16 |
Change the distribution to a more than type distribution, and draw its ogive.
Sol. For ‘more than type’ distribution, we have:
Production yield (in kg/ha) | Number of farms (Cumulative frequencies) |
More than 50 | 100 |
More than 55 | 98 |
More than 60 | 90 |
More than 65 | 78 |
More than 70 | 54 |
More than 75 | 16 |
Now, we plot the points (50, 100), (55, 98), (60, 90), (65, 78), (70, 54) and (75, 16) and join the points with a free hand curve.
The curve so obtained is the ‘more than type ogive’.
|
70 videos|242 docs|187 tests
|
FAQs on NCERT Solutions for Class 10 Maths Chapter 13 - Statistics (Exercise 14.4)
| 1. What is the importance of statistics in everyday life? |  |
| 2. How is statistics used in research studies? |  |
| 3. What are the different types of data in statistics? |  |
| 4. How can statistics be used to interpret survey results? |  |
| 5. What are the limitations of statistics? |  |


