Normal Distribution - Mathematical Methods of Physics, UGC - NET Physics | Physics for IIT JAM, UGC - NET, CSIR NET PDF Download

The normal distribution refers to a family of continuous probability distributions described by the normal equation.
The Normal Equation
The normal distribution is defined by the following equation:
The Normal Equation. The value of the random variable Y is: Y = { 1/[ σ * sqrt(2π) ] } * e-(x - μ)2/2σ2 where X is a normal random variable, μ is the mean, σ is the standard deviation, π is approximately 3.14159, and e is approximately 2.71828. |
The random variable X in the normal equation is called the normal random variable. The normal equation is theprobability density function for the normal distribution.
The Normal Curve
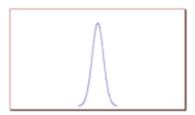
The graph of the normal distribution depends on two factors - the mean and the standard deviation. The mean of the distribution determines the location of the center of the graph, and the standard deviation determines the height and width of the graph. All normal distributions look like a symmetric, bell-shaped curve, as shown below.
Smaller standard deviation
Bigger standard deviation
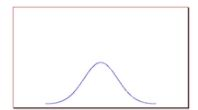
When the standard deviation is small, the curve is tall and narrow; and when the standard deviation is big, the curve is short and wide (see above)
Probability and the Normal Curve
The normal distribution is a continuous probability distribution. This has several implications for probability.
The total area under the normal curve is equal to 1.
The probability that a normal random variable X equals any particular value is 0.
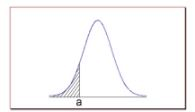
The probability that X is greater than a equals the area under the normal curve bounded by a and plus infinity (as indicated by the non-shaded area in the figure below).
The probability that X is less than a equals the area under the normal curve bounded by a and minus infinity (as indicated by the shaded area in the figure below).
Additionally, every normal curve (regardless of its mean or standard deviation) conforms to the following "rule".
About 68% of the area under the curve falls within 1 standard deviation of the mean.
About 95% of the area under the curve falls within 2 standard deviations of the mean.
About 99.7% of the area under the curve falls within 3 standard deviations of the mean.
Collectively, these points are known as the empirical rule or the 68-95-99.7 rule. Clearly, given a normal distribution, most outcomes will be within 3 standard deviations of the mean.
To find the probability associated with a normal random variable, use a graphing calculator, an online normal distribution calculator, or a normal distribution table. In the examples below, we illustrate the use of Stat Trek'sNormal Distribution Calculator, a free tool available on this site. In the next lesson, we demonstrate the use of normal distribution tables.
Test Your Understanding
Problem 1
An average light bulb manufactured by the Acme Corporation lasts 300 days with a standard deviation of 50 days. Assuming that bulb life is normally distributed, what is the probability that an Acme light bulb will last at most 365 days?
Solution: Given a mean score of 300 days and a standard deviation of 50 days, we want to find the cumulative probability that bulb life is less than or equal to 365 days. Thus, we know the following:
The value of the normal random variable is 365 days.
The mean is equal to 300 days.
The standard deviation is equal to 50 days.
We enter these values into the Normal Distribution Calculator and compute the cumulative probability. The answer is: P( X < 365) = 0.90. Hence, there is a 90% chance that a light bulb will burn out within 365 days.
Problem 2
Suppose scores on an IQ test are normally distributed. If the test has a mean of 100 and a standard deviation of 10, what is the probability that a person who takes the test will score between 90 and 110?
Solution: Here, we want to know the probability that the test score falls between 90 and 110. The "trick" to solving this problem is to realize the following:
P( 90 < X < 110 ) = P( X < 110 ) - P( X < 90 )
We use the Normal Distribution Calculator to compute both probabilities on the right side of the above equation.
To compute P( X < 110 ), we enter the following inputs into the calculator: The value of the normal random variable is 110, the mean is 100, and the standard deviation is 10. We find that P( X < 110 ) is 0.84.
To compute P( X < 90 ), we enter the following inputs into the calculator: The value of the normal random variable is 90, the mean is 100, and the standard deviation is 10. We find that P( X < 90 ) is 0.16.
We use these findings to compute our final answer as follows:
P( 90 < X < 110 ) = P( X < 110 ) - P( X < 90 )
P( 90 < X < 110 ) = 0.84 - 0.16
P( 90 < X < 110 ) = 0.68
Thus, about 68% of the test scores will fall between 90 and 110.
FAQs on Normal Distribution - Mathematical Methods of Physics, UGC - NET Physics - Physics for IIT JAM, UGC - NET, CSIR NET
| 1. What is the normal distribution in mathematical methods of physics? |  |
| 2. How is the normal distribution related to UGC - NET Physics exam? | |
| 3. What are the properties of the normal distribution in the context of mathematical methods of physics? | |
| 4. How is the normal distribution used in analyzing experimental data in physics? | |
| 5. Can you provide an example of how the normal distribution is used in physics? | |


Normal Distribution - Mathematical Methods of Physics
,UGC - NET
,MCQs
,ppt
,CSIR NET
,study material
,Viva Questions
,past year papers
,Normal Distribution - Mathematical Methods of Physics
,UGC - NET Physics | Physics for IIT JAM
,Free
,Important questions
,UGC - NET
,Sample Paper
,Exam
,Extra Questions
,CSIR NET
,Normal Distribution - Mathematical Methods of Physics
,UGC - NET Physics | Physics for IIT JAM
,Previous Year Questions with Solutions
,shortcuts and tricks
,UGC - NET
,Objective type Questions
,Summary
,Semester Notes
,CSIR NET
,video lectures
,UGC - NET Physics | Physics for IIT JAM
,mock tests for examination
,practice quizzes
;


Normal Distribution - Mathematical Methods of Physics, UGC - NET Physics Free PDF Download
Importance of Normal Distribution - Mathematical Methods of Physics, UGC - NET Physics
Normal Distribution - Mathematical Methods of Physics, UGC - NET Physics Notes
Normal Distribution - Mathematical Methods of Physics, UGC - NET Physics Physics Questions
Study Normal Distribution - Mathematical Methods of Physics, UGC - NET Physics on the App
|
© EduRev
|
Education Revolution
|


|


