Overview: Table Analysis | Data Insights for GMAT PDF Download
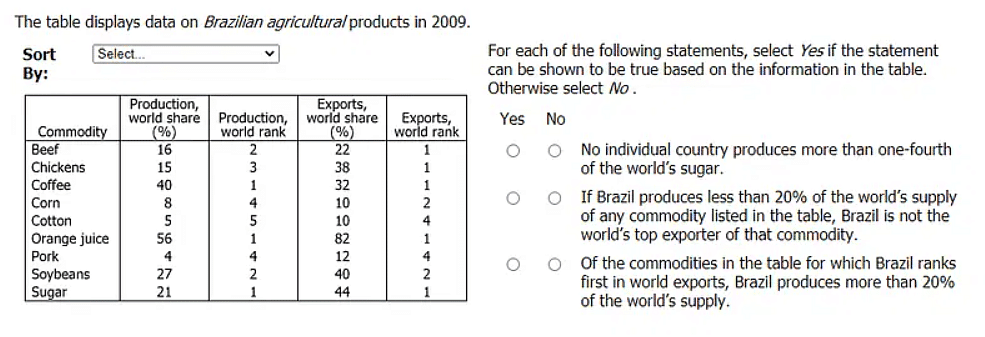
Table analysis questions typically present a tabular format similar to a spreadsheet. This table allows sorting in ascending order based on column titles through a dropdown menu above the table. An accompanying brief text usually explains the contents of the table.
The questions often include three statements, values, or expressions. You might be asked to determine the truth or falsity of each statement or infer a "Yes" or "No" response based on the provided information.
Tasks could involve calculations such as finding the mean, median, or range; computing ratios, proportions, or probabilities; identifying correlations between data sets; comparing data in relation to other data; or selecting the statement that best explains the information presented in the prompt.
These prompts are interactive, requiring an understanding of the most effective way to sort the data to address the specific question asked.
Commonly Tested Concepts in Table Analysis
In Table Analysis tasks, you'll often encounter various statistical concepts. Understanding absolute differences between values, Using sorted data to make informed inferences, Finding central tendencies like mean, median, and mode, Applying measures of dispersion such as absolute deviation, standard deviation, and range. These concepts help in evaluating data variability, patterns, and distribution within datasets, forming the core of Table Analysis assessments.
- Absolute Deviation Calculation: This involves determining how much individual data points differ from the mean of the dataset.
- Sorting and Inferring: This refers to arranging data within the table and drawing conclusions or making inferences based on the organized information.
- Mean, Median, and Mode: These fundamental statistical measures include the mean (average obtained by summing all data points and dividing by their count), median (the middle value in a dataset), and mode (the most frequently occurring value).
- Deviation: This concept entails measuring the difference between a specific value in the dataset and another value, typically the dataset's mean.
- Range: It involves calculating the difference between the highest and lowest values present in a dataset.
- Standard Deviation: Often used to gauge the spread of scores in a dataset, it calculates how much individual data points deviate from the mean of the overall dataset.
- Correlation: This involves identifying a linear relationship between two variables within the dataset, assessing how changes in one variable correspond to changes in another.
Process of Solving Table Analysis Questions
1. Understanding the Dataset:
- Review the question description, table title, and column headings to comprehend their relationship.
- Note any additional information provided outside the table to understand the columns better.
- Don't be overwhelmed by the size of the table; focus on a few relevant columns and rows.
- Quickly scan through to ascertain whether data is in integers or decimals and simplify decimals if needed.
2. Understanding the Question:
- Comprehend the three dichotomous statement-type questions provided.
- Restate the question in your own words and consider translating it into mathematical terms if necessary.
3. Developing an Approach:
- Recognize multiple approaches to tackle a question.
- Opt for the most efficient strategy, considering limitations like single-column sorting even if the question requires multi-column sorting.
4. Applying the Approach:
- Implement the chosen approach to sort the table accordingly.
- Record the outcomes of any calculations performed, as these might be essential for subsequent questions.
Solved Examples
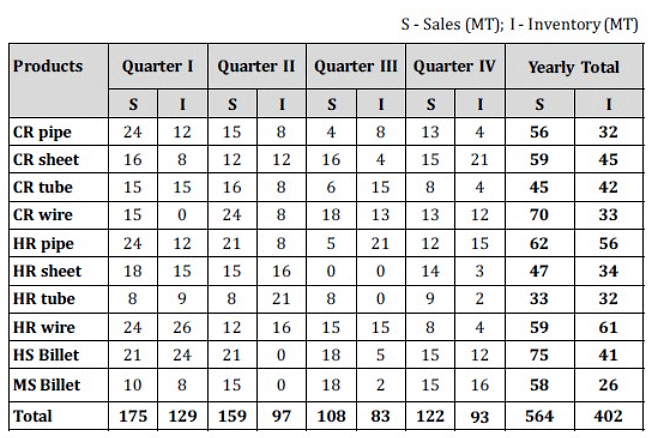
The table presents quarterly sales and inventory data, in metric tons (MT), for Apex Corporation for a few steel products.
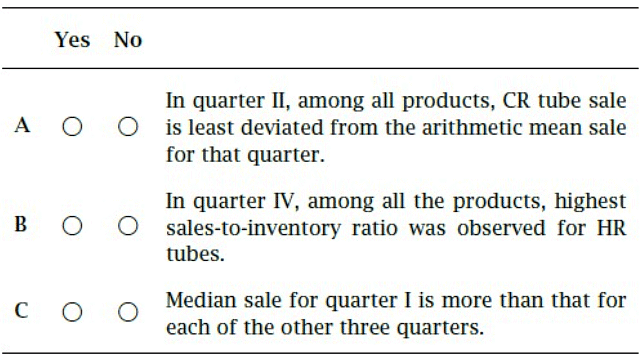
For each of the following statements, select "Yes" if the statement is true based on the information provided; otherwise select "No."
Solution, Part A
The question wants you to find out whether in the Q2, the deviation (difference) of CR tube sale from the Q2 arithmetic mean sale is less than that of other products.
In other words, the question statement states that for Q2, the sales of CR tube is closest to Q2 mean sales.
Mathematically, this means:
|CR tube sales − mean sales for Q2| < |Other products' sales − mean sales for Q2|
First, you calculate the mean sales for Q2.
Since
Total Q2 sales = 159 MT
and
Total number of products = 10
then
Q2 mean sales = 159/10 = 15.9 MT
So,
|CR Tube sales − mean sales for Q2| = |16 − 15.9| = 0.1
Run through the values in column 4 (Q2 sales) and mentally deduct each value from 15.9. You will find that the deviation of CR Tube sales = 0.1 is the lowest among that of all the other products.
The answer for part A is "Yes."
Solution, Part B
The question wants you to find out whether in the Q4, the ratio of sales to inventory for HR~tubes is more than that for other products.
Mathematically, this means that for Q4,
You have nine products for which you need to calculate the sales-to-inventory ratio, but that would be too time-consuming, and hence it is not advisable to compute.
A better approach would be to calculate a few select values. You know that for HR tubes, the value is 4.5, which is more than 1. You can skip the products for which sales are less than their inventory as the sales-to-inventory ratio value would be less than 1. Secondly, you can mentally divide sales by inventory to get probable contenders that have values, equalling more than 4. There is only one such product: HR sheets, which has a sales-to-inventory value equal to 14/3 = 4.67, more than 4.5, so the statement is wrong.
The answer for part B is "No."
Solution, Part C
The question wants you to find out whether median sales for Q1 is more than median sales for each of Q2, Q3, and Q4.
Mathematically, this means:
Median salesQ1 > Median salesany other quarter
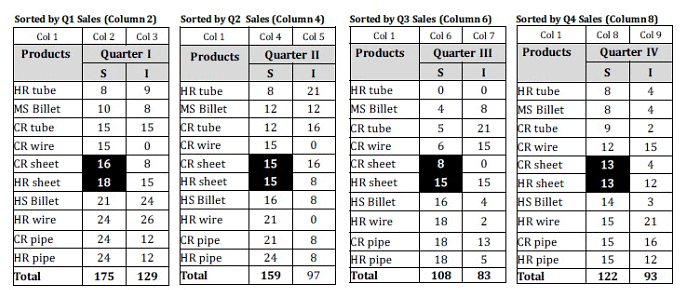
To get the median sales of each quarter, sort the table by its sales columns to get the table: Median Sales for Q1:
Median of a series = value of the  term
term
Here, median sales for Q1 equals:
Value of  product = value of the 5.5th product.
The value of the 5.5th product equals
Average of 16 & 18 = (16 + 18)/2 = 17 MT
Similarly, median sales for Q2, Q3, and Q3 are (15 + 15)/2 = 15, (8 + 15)/2 = 11.5, and (13 + 13)/2 = 13 MT, respectively. Hence, the statement is correct.
The answer for the part C is "Yes."
|
24 videos|28 docs|21 tests
|
FAQs on Overview: Table Analysis - Data Insights for GMAT
| 1. What is table analysis in the context of the GMAT? |  |
| 2. What are some commonly tested concepts in table analysis questions? |  |
| 3. What is the process of solving table analysis questions? |  |
| 4. Can you provide an example of a table analysis question? |  |
| 5. How can one improve their table analysis skills for the GMAT? |  |


