Overview and Syllabus: Data Insights | Data Insights for GMAT PDF Download
| Table of contents |

|
| Overview of Data Insights Section |

|
| Importance of Data Insights in GMAT Scoring |

|
| Syllabus of Data Insights |

|
| Strategies for Improving Data Insights Score |

|
The Graduate Management Admission Test (GMAT) has always been a significant factor in gaining entry into prestigious business programs. Now, to align with the changing dynamics of the business world, the GMAT has undergone a transformation known as the GMAT Focus Edition. This updated version consists of three main sections: Quantitative, Verbal, and the newly introduced Data Insights.
The addition of Data Insights might sound completely new, but it essentially consolidates Integrated Reasoning and Data Sufficiency from the Quantitative Reasoning section into a single segment called Data Insights.

In the revamped GMAT Focus Edition, the Quantitative Reasoning section will no longer feature Data Sufficiency questions. Instead, this section will focus solely on problem-solving questions. This adjustment reflects the GMAT's commitment to staying current with the evolving needs of business education and assessment.
Overview of Data Insights Section
The GMAT Data Insights (DI) might seem new, but it's basically a mix of Integrated Reasoning and Data Sufficiency from the Quantitative Reasoning part, all rolled into one section.
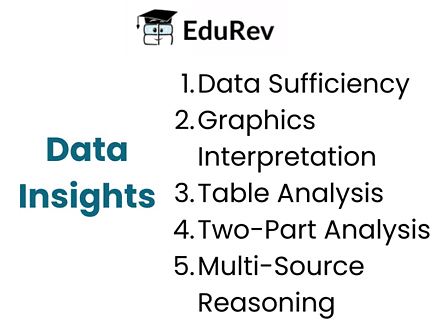
This Data Insights part has five types of questions: Data Sufficiency, Graphics Interpretation, Table Analysis, Two-Part Analysis, and Multi-Source Reasoning. They test a bunch of skills, from doing math to understanding what you read and thinking critically.
Data Sufficiency questions are like the ones in the current GMAT Quant section. The rest—Graphics Interpretation, Table Analysis, Two-Part Analysis, and Multi-Source Reasoning—are like the ones in the Integrated Reasoning section. But now, in the Data Insights section, they're all together in one big part that really affects your total score, which is different from how it works in the current GMAT.
Just to break it down:
- Data Sufficiency checks how well you do with math and figuring out if you have enough info.
- Graphics Interpretation sees if you can understand and make sense of data shown in pictures.
- Table Analysis checks if you can get the right info from tables.
- Two-Part Analysis looks at how you solve problems when they're connected.
- Multi-Source Reasoning tests if you can use info from different places.
Importance of Data Insights in GMAT Scoring
In the new GMAT Focus Edition, the Data Insights part is just as important as the Math and Reading sections. Each of these three parts now counts the same toward your overall GMAT score. Your score in Data Insights affects your total GMAT score directly. If you do well in this part, it can really boost your overall score.
Because data is more and more crucial for business choices, the skills tested in the Data Insights section matter a lot for today's business education.
Syllabus of Data Insights
Let’s discuss each question type:
1) Data Sufficiency Questions (DS):
These questions present you with a mathematical problem and two separate statements labeled (1) and (2). The goal is not necessarily to solve the problem but to determine whether the information given in the statements, either separately or together, is sufficient to solve the problem. DS questions assess your ability to identify the key pieces of information needed to solve a problem and your understanding of the concepts of “sufficient” and “insufficient” data.
2) Graphics Interpretation Questions (GI):
These questions require you to interpret and analyze information presented in a graph or other visual display, such as a scatter plot, x-y graph, bar graph, pie chart, or statistical curve distribution. GIQs challenge your ability to extract relevant information from visual data, draw inferences, identify relationships and patterns, and apply those insights to answer related questions.
3) Table Analysis Questions (TA):
For these questions, you are given a table of data that you can sort on various columns. A set of statements follows the table, and you have to determine whether each statement is true or false based on the information in the table. TAQs test your ability to analyze and synthesize data from a table, discern patterns or trends, and make accurate statements about the data.
4) Two-Part Analysis Questions (TPA):
These questions provide a problem that has two related parts. Your task is to find the correct answer to each part, keeping in mind that the answers are interconnected. The format can be either mathematical or verbal, requiring you to tap into skills such as logical reasoning, text analysis, or quantitative problem-solving.
5) Multi-Source Reasoning Questions (MSR):
MSR questions present you with data from multiple sources, which could be short texts, charts, or tables. These questions require you to effectively analyze, interpret, and integrate information from various sources to solve complex problems. They test your ability to navigate and synthesize multi-faceted information and your aptitude for decision-making based on that information.
Strategies for Improving Data Insights Score
- Check where you stand: Take a practice test to see how you're doing in Data Sufficiency, Graphics Interpretation, Table Analysis, Two-Part Analysis, and Multi-Source Reasoning. This gives you a starting point.
- Make your study plan: Use a personalized study plan (PSP) to figure out what to study and how much time you need. Match your target scores in DI with what you need and want. The PSP is like a roadmap to help you succeed.
- Focus on what needs work: Start by working on areas where you're below the 30th percentile. Begin with Table Analysis and Graphics Interpretation, then move on to Two-Part Analysis and Multi-Source Reasoning. Build up your basics first.
- Solidify what you've learned: After each section, make sure you really understand it. Aim for 55% accuracy in tough questions if you're aiming for the 70th percentile. If you want a score in the 90th percentile or higher, go for 70% accuracy. Read more about this in the Study Plan article for extra tips.
- Practice with full tests: Take practice tests regularly to see how you're doing across all areas. This keeps you in line with your overall plan.
- Look at how you're doing: Detailed feedback shows where you need more work. Use this info to adjust your efforts.
- Polish and review: Finally, practice and review the topics where you need more help. This helps you reach your target DI score and makes sure you really get it.
|
24 videos|28 docs|21 tests
|
FAQs on Overview and Syllabus: Data Insights - Data Insights for GMAT
| 1. What is the importance of Data Insights in GMAT scoring? |  |
| 2. What is the syllabus for the Data Insights section of the GMAT? |  |
| 3. What are some strategies for improving the Data Insights score in the GMAT? |  |
| 4. How can data insights be applied in real-world scenarios beyond the GMAT exam? |  |
| 5. Are there any specific resources or study materials available to prepare for the Data Insights section of the GMAT? |  |


