This EduRev document offers 20 Multiple Choice Questions (MCQs) from the topic Pie Chart (Level - 1). These questions are of Level - 1 difficulty and will assist you in the preparation of CAT & other MBA exams. You can practice/attempt these CAT Multiple Choice Questions (MCQs) and check the explanations for a better understanding of the topic.
Question for Practice Questions Level 1: Pie Chart
Try yourself:Directions: Study the given information carefully and answer the following question.
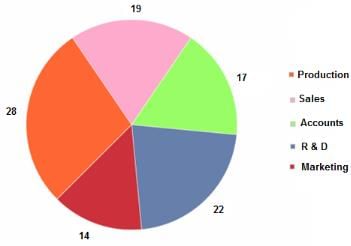
The following pie chart shows the distribution of employees (in %) working in different departments of a company.
Total number of employees = 2400
What is the total number of employees working in Accounts, Production and Marketing?
Explanation
Number of employees working in Accounts = 17% of 2400 = 408
Number of employees working in Production = 28% of 2400 = 672
Number of employees working in Marketing = 14% of 2400 = 336
Therefore, total number of employees working in Accounts, Production and Marketing = 408 + 672 + 336 = 1416
Report a problem
Question for Practice Questions Level 1: Pie Chart
Try yourself:Directions: Study the following information and answer the question that follows.
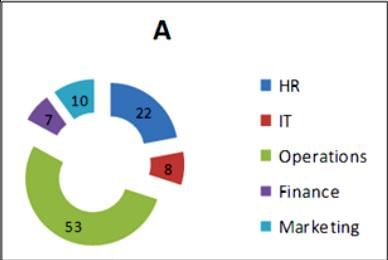
The percentage of employees in various departments in company A is as shown below.
There are 1800 employees in total.
How many employees are there in marketing and finance departments?
Explanation
10% of the total employees are in marketing and 7% in finance.
So, the number of employees in marketing and finance departments.
= (10 + 7)% of 1800
= 306
Report a problem
Question for Practice Questions Level 1: Pie Chart
Try yourself:Directions: Answer the given question based on the following information.
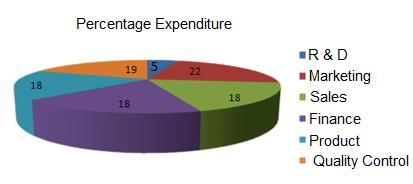
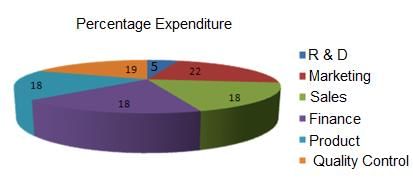
The pie chart below shows the expenditure of a company on different sectors.
Total budget of the company = Rs. 1660 crore
What is the average expenditure on marketing and sales?
Explanation
Average expenditure on marketing and sales = 
= 20% of 1660 crore
= (20/100) x 1660 crore
= 2 x 166 crore
= Rs. 332 crore
Report a problem
Question for Practice Questions Level 1: Pie Chart
Try yourself:Directions: Answer the given question based on the following information.
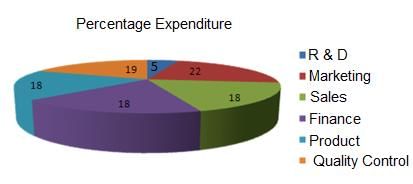
The pie chart below shows the expenditure of a company on different sectors.
Total budget of the company = Rs. 1660 crore
What is the total expenditure on marketing, sales and finance?
Explanation
Expenditure on marketing, sales and finance = (22% + 18% + 18%) of 1660 crore = 58% of 1660 crore
= (58/100) x 1660 crore
= Rs. 962.8 crore
Report a problem
Question for Practice Questions Level 1: Pie Chart
Try yourself:Directions: Answer the given question based on the following information.
The pie chart below shows the expenditure of a company on different sectors.
Total budget of the company = Rs. 1660 crore
What is the expenditure on R & D?
Explanation
Expenditure on R & D = 5% of 1660 crore
= (5/100) x 1660 crore
= Rs. 83 crore
Report a problem
Question for Practice Questions Level 1: Pie Chart
Try yourself:Directions: Study the following pie charts and answer the question.
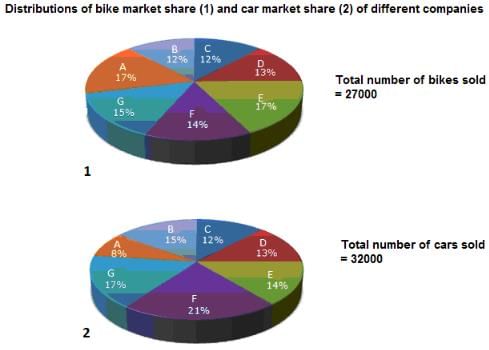
What is the total number of bikes and cars sold by company F?
Explanation
Total number of bikes sold by company F = 27000 x 0.14 = 3780
Total number of cars sold by company F = 32000 x 0.21 = 6720
Total bikes and cars sold by company F = 3780 + 6720 = 10500
Report a problem
Question for Practice Questions Level 1: Pie Chart
Try yourself:Directions: Study the following pie charts and answer the question.
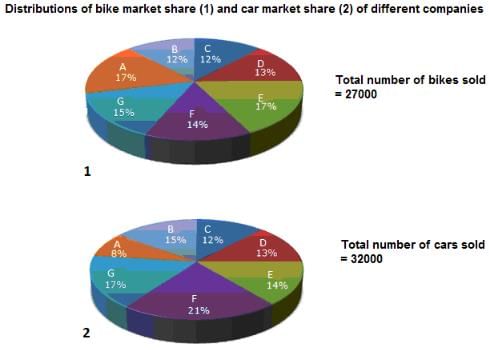
Total number of bikes sold by companies A, B and C is
Explanation
Total % of bikes sold by companies A, B and C = 17 + 12 + 12 = 41%
Number of bikes sold = 27000 × 0.41 = 11070
Report a problem
Question for Practice Questions Level 1: Pie Chart
Try yourself:Directions: Study the following pie charts and answer the question.
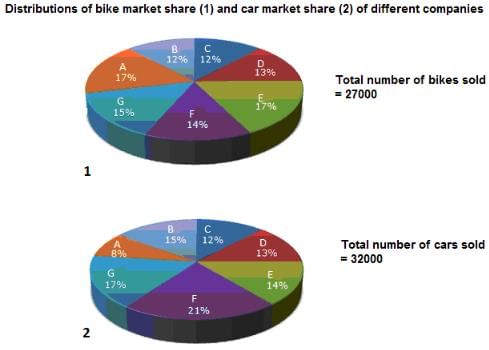
What is the ratio of the number of bikes to that of cars sold by company E?
Explanation
Number of bikes sold by Company E = (17% of 27,000) = 4590
Number of cars sold Company E = (14% of 32,000) = 4480
Required ratio = 459 : 448
Report a problem
Question for Practice Questions Level 1: Pie Chart
Try yourself:Directions: Study the following pie charts and answer the question.
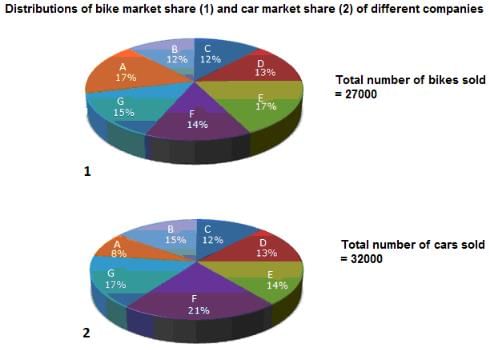
What is the percentage of bikes sold by company G to the total sale of bikes and cars by all companies?
Explanation
Bikes sold by company G = 15% of 27000 = 4050
Total number of bikes and cars sold = 59000
Required percentage = (4050/59000) × 100 = 6.86%
Report a problem
Question for Practice Questions Level 1: Pie Chart
Try yourself:Directions: The question is based on the following graph.
Pattern of Runs Scored by Lara in a Series of Six Test Matches.
Note : Runs scored are calculated to nearest whole number.
Total Runs = 664
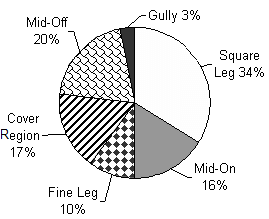
From the pattern of the runs scored, Lara is strongest in which of the following regions?
Explanation
From the pie chart, It is observed that Lara scored 34% runs in the square leg region. Thus, he is the strongest in the square leg region.
Report a problem
Question for Practice Questions Level 1: Pie Chart
Try yourself:Directions: The question is based on the following graph.
Pattern of Runs Scored by Lara in a Series of Six Test Matches.
Note : Runs scored are calculated to nearest whole number.
Total Runs = 664
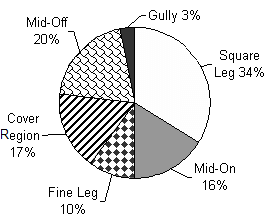
Runs scored in the gully region form what percentage of runs scored in the fine leg region?
Explanation
Required percentage = (3% of 664)/(10% of 664) × 100 = (3/10) × 100 = 30%
Report a problem
Question for Practice Questions Level 1: Pie Chart
Try yourself:Directions: The question is based on the following graph.
Pattern of Runs Scored by Lara in a Series of Six Test Matches.
Note : Runs scored are calculated to nearest whole number.
Total Runs = 664
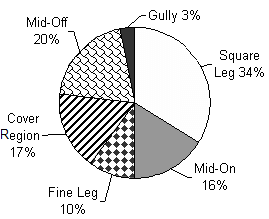
Had Lara struck four more 4's in the cover region(provided all other percentages remain same), the percentage of runs he scored in the cover region as a percentage of total runs would have been
Explanation
Total runs after four more 4's = 664 + 16 = 680
Runs scored in the cover region after four more 4's = 664 × (17/100) + 16
New percentage of runs scored in the cover region as a percentage of total runs =  × 100 = 18.95%
Report a problem
Question for Practice Questions Level 1: Pie Chart
Try yourself:Directions: The question is based on the following graph.
Pattern of Runs Scored by Lara in a Series of Six Test Matches.
Note : Runs scored are calculated to nearest whole number.
Total Runs = 664
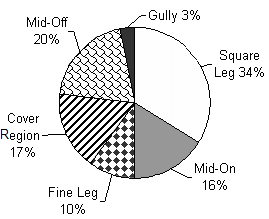
If Lara's average before the beginning of the first test of the series was 50.84 in 90 innings and he played a total of 11 innings in this series, the average score per innings of Lara at the end of the series was
Explanation
Total runs scored in 101(90 + 11) innings = 50.84 × 90 + 664
New average =  = 51.9
Report a problem
Question for Practice Questions Level 1: Pie Chart
Try yourself:Directions: The following pie charts give information about the percentage distribution of total notebooks of different brands sold by a book store during different months and the percentage distribution of profit earned from the sale of each brand:
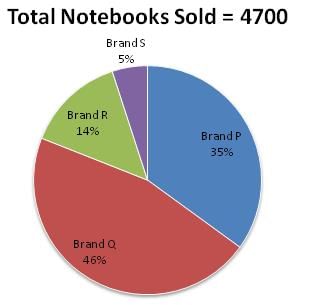
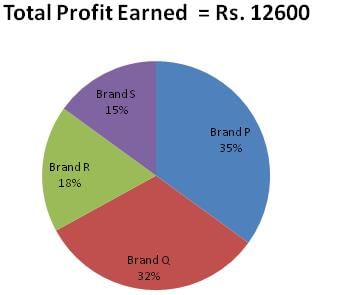
If the book store offered 20% discount on brand P notebooks and earned 20% profit, then what was the marked price per notebook of brand P?
Explanation
Let CP of a notebook of brand P be Rs. c.
0.2c = (12,600 x 0.35)/(4700 x 0.35) = Rs. 2.68
1.2c = Rs. 16.08
MP = 16.08/0.8 = Rs. 20.1
Report a problem
Question for Practice Questions Level 1: Pie Chart
Try yourself:Directions: The following pie charts give information about the percentage distribution of total notebooks of different brands sold by a book store during different months and the percentage distribution of profit earned from the sale of each brand:
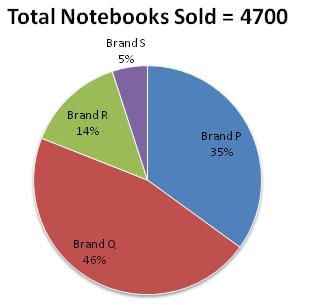
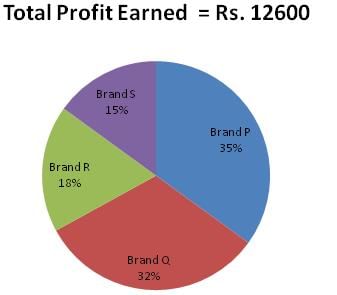
The profit earned per notebook of brand Q is what percent of the profit earned per notebook of brand R?
Explanation
Profit earned per notebook of brand Q = (12,600 x 0.32)/(4700 x 0.46) = Rs. 1.86
Profit earned per notebook of brand R = (12,600 x 0.18)/(4700 x 0.14) = Rs. 3.45
Required Percent = (1.86 x 100)/3.45 = 53.91%
Report a problem
Question for Practice Questions Level 1: Pie Chart
Try yourself:Directions: The following pie charts give information about the percentage distribution of total notebooks of different brands sold by a book store during different months and the percentage distribution of profit earned from the sale of each brand:


If each notebook of brand S was sold at a 25% profit after offering a 30% discount, then what was its marked price?
Explanation
Let CP of each notebook of brand S be Rs. y and MP be Rs. z.
0.25y = (12,600 x 0.15)/(4700 x 0.05) = Rs. 8.04
y = Rs. 32.16
1.25y = Rs. 40.2
0.7z = 40.2
z = Rs. 57.43
Report a problem
Question for Practice Questions Level 1: Pie Chart
Try yourself:Directions: Study the given pie chart carefully and answer the following question.
The following pie chart shows the total number of cars sold by eight car companies during the year 2016:
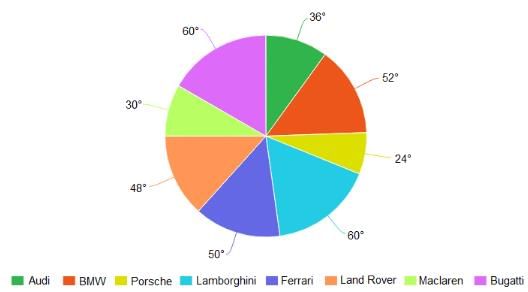
If the total number of cars sold by Ferrari was 44,000, then what was the difference between the total number of cars sold by Bugatti and that sold by Porsche?
Explanation
Report a problem
Question for Practice Questions Level 1: Pie Chart
Try yourself:Directions: Study the given pie chart carefully and answer the following question.
The following pie chart shows the total number of cars sold by eight car companies during the year 2016:
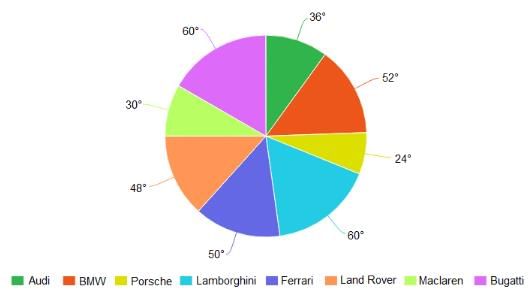
What is the ratio of 20% of the total cars sold by Land Rover to 50% of the total cars sold by Audi?
Explanation
Report a problem
Question for Practice Questions Level 1: Pie Chart
Try yourself:Directions: Study the given pie chart carefully and answer the following question.
The following pie chart shows the total number of cars sold by eight car companies during the year 2016:
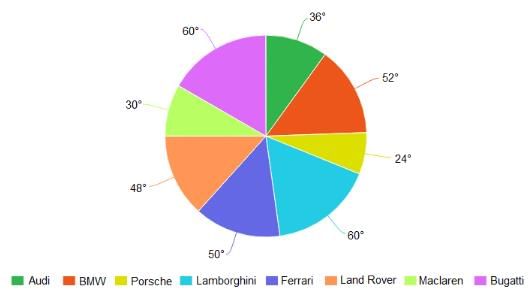
If the number of cars sold by Maclaren is 36,000, then what is the sum of two-thirds of the cars sold by BMW and nine-tenths of the cars sold by Lamborghini?
Explanation
Report a problem
Question for Practice Questions Level 1: Pie Chart
Try yourself:Directions: Study the given pie chart carefully and answer the following question.
The following pie chart shows the total number of cars sold by eight car companies during the year 2016:
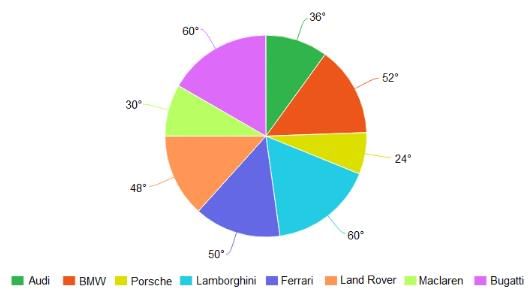
What percent more cars were sold by Ferrari and Land Rover together than sold by Porsche and Lamborghini together?
Explanation
Report a problem


 × 100 = 18.95%
 = 51.9

 = 31,680


 : 5
: 5 


 = 16.67%


