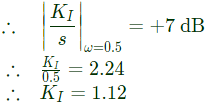
Q1: Consider the stable closed-loop system shown in the figure. The magnitude and phase values of the frequency response of G(s) are given in the table. The value of the gain K1(>0) for a 50° phase margin is (rounded off to 2 decimal places). (2024)

 (a) 1.12
(b) 2.25
(c) 1.68
(d) 2.92
Ans: (a)
Sol: 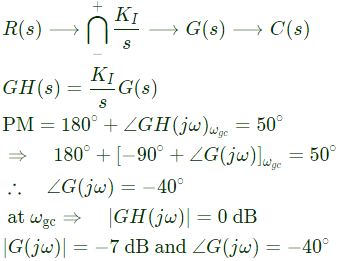
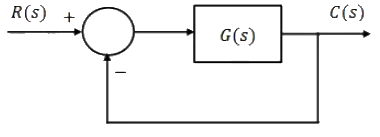
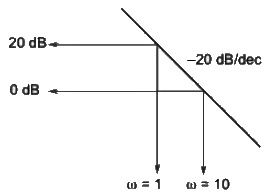
Q2: Consider the stable closed-loop system shown in the figure. The asymptotic Bode magnitude plot of G(s) has a constant slope of −20 dB/ decade at least till 100rad/sec with the gain crossover frequency being 10rad/sec. Hie asymptotic Bode phase plot remains constant at −90° at least till ω = 10rad/sec. The steady-state error of the closed-loop system for a unit ramp input is _____ (rounded off to 2 decimal places). (2024)
 (a) 0.25
(b) 0.1
(c) 0.36
(d) 0.42
Ans: (b)
Sol: Initial slppe = −20 dB/sec
Open loop transfer function = k/s
20 log10k = 20
k = 10
 ess for type -1 system for ramp input

Q3: Consider a lead compensator of the form
 The frequency at which this compensator produces maximum phase lead is 4rad/s. At this frequency, the gain amplification provided by the controller, assuming asymptotic Bodemagnitude plot of K( s), is 6 dB. The values of α, β, respectively, are (2023)
(a) 1, 16
(b) 2, 4
(c) 3, 5
(d) 2.66, 2.25
Ans: (b)
Sol: K(s) 
Max. phase lead occur at,  Given : ωm = 4rad/sec
 Now,
Now,

Put, s = jω
 Given : M = 6
20 log(4/a) = 6
⇒ a = 2
From eqn. (1), we get

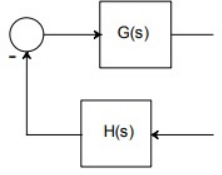
Q4: In the Nyquist plot of the open-loop transfer function
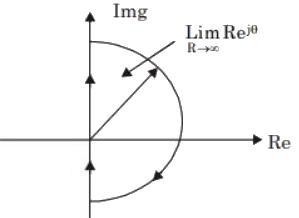
 corresponding to the feedback loop shown in the figure, the infinite semi-circular arc of the Nyquist contour in s-plane is mapped into a point at (2023)
 (a) G(s)H(s) = ∞
(b) G(s)H(s) = 0
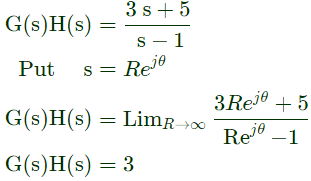
(c) G(s)H(s) = 3
(d) G(s)H(s) = −5
Ans: (c)
Sol: Nyquist Contour :
 Given:
Q5: The open loop transfer function of a unity gain negative feedback system is given as
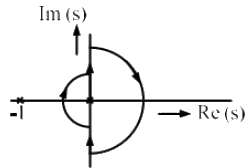
 The Nyquist contour in the s-plane encloses the entire right half plane and a small neighbourhood around the origin in the left half plane, as shown in the figure below. The number of encirclements of the point (−1 + j0) by the Nyquist plot of G(s), corresponding to the Nyquist contour, is denoted as N. Then N equals to (2022)
 (a) 0
(a) 0
(b) 1
(c) 2
(d) 3
Ans: (b)
Sol: Given: P = 1 (Because, Nyquist contour encircle one pole i.e s = 0)
We have, N = P - Z
N = 1 - Z
Characteristic equation
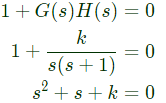 R-H criteria:
 Hence, z = 0 (because no sign change in first column of R-H criteria)
(where, z = closed loop pole on RHS side of s-plane)
Therefore, N = 1.
Q6: An LTI system is shown in the figure where
 The steady state output of the system, to the input r(t), is given as y(t) = a + b sin(10t + θ). The values of a and b will be (2022)
 (a) a = 1, b = 10
(b) a = 10, b = 1
(c) a = 1, b = 100
(d) a = 100, b = 1
Ans: (a)
Sol: 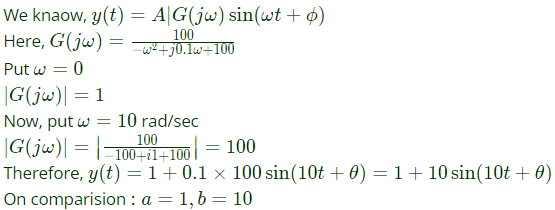
Q7: The Bode magnitude plot of a first order stable system is constant with frequency. The asymptotic value of the high frequency phase, for the system, is −180°. This system has (2022)
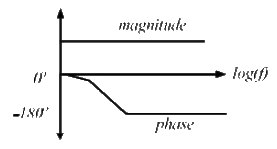 (a) one LHP pole and one RHP zero at the same frequency
(b) one LHP pole and one LHP zero at the same frequency
(c) two LHP poles and one RHP zero
(d) two RHP poles and one LHP zero.
Ans: (a)
Sol: The given system is non-minimum phase system Therefore, transfer function, 
Hence, one LHP pole and one RHP zero at the same frequency.
Q8: The Bode magnitude plot for the transfer function  of the circuit is as shown. The value of R is _____________ Ω. (Round off to 2 decimal places.) (2021)
 (a) 0.1
(b) 0.2
(c) 0.25
(d) 0.05
Ans: (a)
Sol: From response plot
Mr = 26 dB = 20
∴ 
∴ 
From electrical network
 ∴ R = 0.10Ω
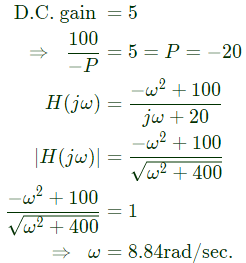
Q9: A stable real linear time-invariant system with single pole at p, has a transfer function  with a dc gain of 5. The smallest positive frequency, in rad/s at unity gain is closed to: (2020)
(a) 8.84
(b) 11.08
(c) 78.13
(d) 122.87
Ans: (a)
Sol: 
Q10: Consider a negative unity feedback system with forward path transfer function  where K, a, b, c are positive real numbers. For a Nyquist path enclosing the entire imaginary axis and right half of the s-plane in the clockwise direction, the Nyquist plot of (1 + G(s)), encircles the origin of (1 + G(s))-plane once in the clockwise direction and never passes through this origin for a certain value of K. Then, the number of poles of
  lying in the open right half of the s-plane is _________ . (2020)
(a) 1
(b) 2
(c) 3
(d) 4
Ans: (b)
Sol: 

Q11: The asymptotic Bode magnitude plot of a minimum phase transfer function G(s) is shown below.
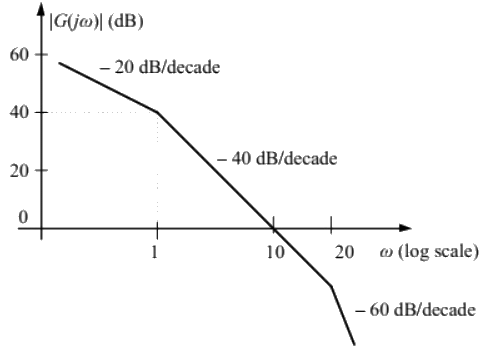 Consider the following two statements.
Statement I: Transfer function G(s) has three poles and one zero.
Statement II: At very high frequency (ω → ∞), the phase angle ∠G(jω) = −(3π/2).
Which one of the following options is correct? (2019)
(a) Statement I is true and statement II is false.
(b) Statement I is false and statement II is true.
(c) Both the statements are true
(d) Both the statements are false
Ans: (b)
Sol: 
Transfer function shows 2 poles and no zeros. So statement I is false.
 So statement II is true.
Q12: The open loop transfer function of a unity feedback system is given by
 In G(s) plane, the Nyquist plot of G(s) passes through the negative real axis at the point (2019)
(a) (-0.5, j0)
(b) (-0.75, j0)
(c) (-1.25, j0)
(d) (-1.5, j0)
Ans: (a)
Sol: 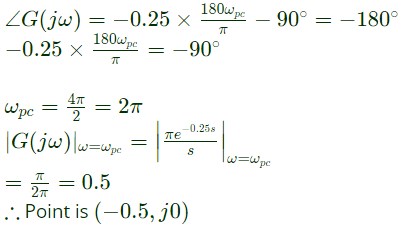
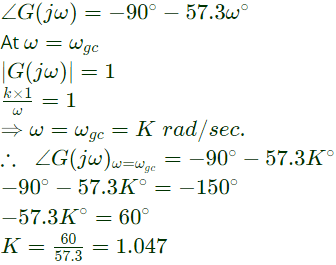
Q13: Consider the unity feedback control system shown. The value of K that results in a phase margin of the system to be 30° is _______. (SET-1(2017))
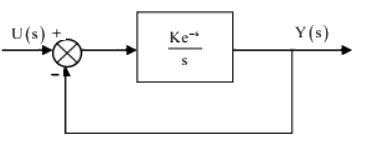 (a) 0.5
(b) 1.04
(c) 2.09
(d) 4.029
Ans: (b)
Sol: Forward path transfer function, 
Given,
Phase margin = 30°
Phase margin = 180° + ϕ
 [where ωgc is gain crossover frequency]
Q14: The transfer function of a system is given by 
Let the output of the system be vo(t) = Vmsin(ωt + φ) for the input vi(t) = Vmsin(ωt).
Then the minimum and maximum values of φ (in radians) are respectively (SET-1 (2017))
(a) 
(b) 
(c) 0 and π/2
(d) −π and 0
Ans: (d)
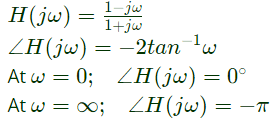
Sol:  For the minimum and maximum values of ′ϕ′
Q15: Loop transfer function of a feedback system is G(s)H(s) = ((s+3)/(s2(s−3))). Take the Nyquist contour in the clockwise direction. Then, the Nyquist plot of G(s)H(s) encircles -1 + j0 (SET-1 (2016))
(a) once in clockwise direction
(b) twice in clockwise direction
(c) once in anticlockwise direction
(d) twice in anticlockwise direction
Ans: (a)
Sol: Nyquist plot of G(s)H(s) =  is as shown below
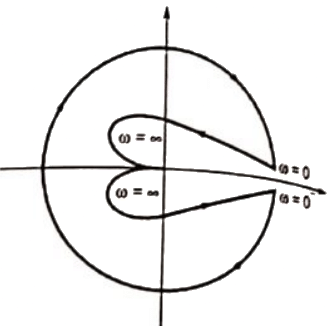 From the Nyquist plot G(s)H(s) encircle -1 + j0 once in clockwise direction.
Alternate Solution:
Characteristic equation,
 using Routh's array
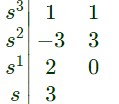 There are two sign changes, hence two poles in right side of s-plane exist.
Z = 2, P = 1
N = P − Z = −1
One encirclement in clockwise direction.
Q16: Consider the following asymptotic Bode magnitude plot (ω is in rad/s).
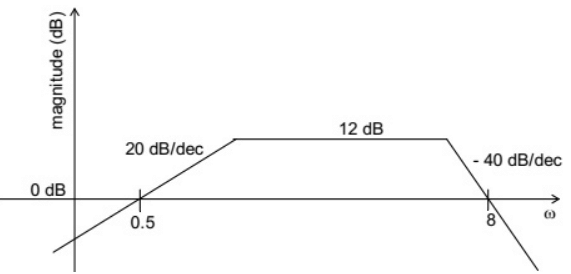 Which one of the following transfer functions is best represented by the above Bode magnitude plot? (SET-1(2016))
(a) 
(b) 
(c) 
(d) 
Ans: (a)
Sol: From the given Bode plot, it is evident that there are 3(three) poles in the transfer function, out of which there are double poles at corner frequency near but less than ω = 8 rad/sec and one pole is near but greater than ω = 0.5 rad/sec. The initial slope is +20 dB/dec. Therefore one zero exist at s = 0. So from all the given options, option (A) satisfies all the conditions. Therefore Option (A) is correct.
Q17: The phase cross-over frequency of the transfer function G(s) = 100/(s+3)3 in rad/s is (SET-1(2016))
(a) √3
(b) 1/√3
(c) 3
(d) 3√3
Ans: (a)
Sol: 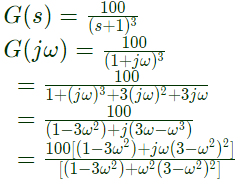 For phase corssover frequency ωphImg[G(jω)] = 0;
Hence, ω(3 − ω2) = 0
ω = 0; ± √3
Therefore, ωph = √3 rad/sec
Q18: Nyquist plots of two functions G1(s) and G2(s) are shown in figure.
 Nyquist plot of the product of G1(s) and G2(s) is (SET-2(2015))
(a) 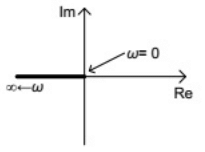 (b)
(b) 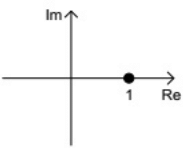 (c)
(c) 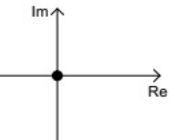 (d)
(d) 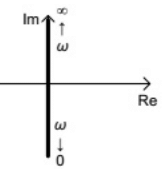 Ans: (b)
Sol: 
Q19: A Bode magnitude plot for the transfer function G(s) of a plant is shown in the figure. Which one of the following transfer functions best describes the plant? (SET-1(2015))
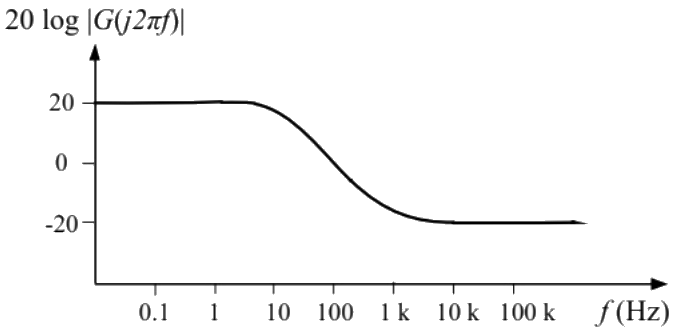 (a)
(a) 
(b) 
(c) 
(d) 
Ans: (d)
Sol: From initial line equation,
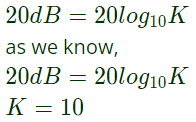 now, from the given plot we know type of system is one.
Hence, 

Q20: The magnitude Bode plot of a network is shown in the figure
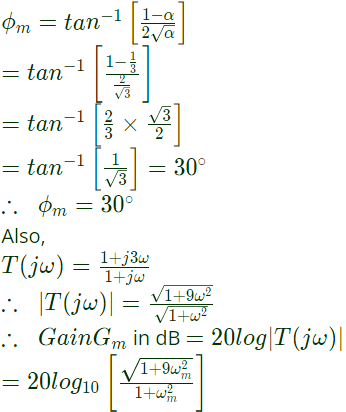
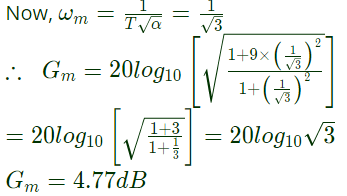
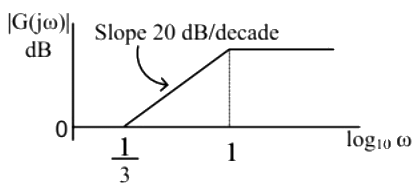 The maximum phase angle ϕm and the corresponding gain Gm respectively, are (SET-3(2014))
(a) −30° and 1.73 dB
(b) −30° and 4.77 dB
(c) +30° and 4.77 dB
(d) +30° and 1.73 dB
Ans: (c)
Sol: From the given Bode plot, it is clear that corner frequencies,
 ∴ Transfer function of given system is given by
 As α < 1, therefore the transfer function T(s) represents a lead compensator having α = 1/3
∴ Maximum phase shift,

 (a) 1.12

 (a) 0.25
 ess for type -1 system for ramp input
 The frequency at which this compensator produces maximum phase lead is 4rad/s. At this frequency, the gain amplification provided by the controller, assuming asymptotic Bodemagnitude plot of K( s), is 6 dB. The values of α, β, respectively, are (2023)
 Given : ωm = 4rad/sec
 Now,
Now,
 Given : M = 6
 corresponding to the feedback loop shown in the figure, the infinite semi-circular arc of the Nyquist contour in s-plane is mapped into a point at (2023)
 (a) G(s)H(s) = ∞
 Given:
 The Nyquist contour in the s-plane encloses the entire right half plane and a small neighbourhood around the origin in the left half plane, as shown in the figure below. The number of encirclements of the point (−1 + j0) by the Nyquist plot of G(s), corresponding to the Nyquist contour, is denoted as N. Then N equals to (2022)
 (a) 0
(a) 0 R-H criteria:
 Hence, z = 0 (because no sign change in first column of R-H criteria)
 The steady state output of the system, to the input r(t), is given as y(t) = a + b sin(10t + θ). The values of a and b will be (2022)
 (a) a = 1, b = 10
 (a) one LHP pole and one RHP zero at the same frequency
 of the circuit is as shown. The value of R is _____________ Ω. (Round off to 2 decimal places.) (2021)
 (a) 0.1

 ∴ R = 0.10Ω
 with a dc gain of 5. The smallest positive frequency, in rad/s at unity gain is closed to: (2020)

 where K, a, b, c are positive real numbers. For a Nyquist path enclosing the entire imaginary axis and right half of the s-plane in the clockwise direction, the Nyquist plot of (1 + G(s)), encircles the origin of (1 + G(s))-plane once in the clockwise direction and never passes through this origin for a certain value of K. Then, the number of poles of
  lying in the open right half of the s-plane is _________ . (2020)

 Consider the following two statements.
 So statement II is true.
 In G(s) plane, the Nyquist plot of G(s) passes through the negative real axis at the point (2019)
 (a) 0.5
 [where ωgc is gain crossover frequency]


 For the minimum and maximum values of ′ϕ′
 is as shown below
 From the Nyquist plot G(s)H(s) encircle -1 + j0 once in clockwise direction.
 using Routh's array
 There are two sign changes, hence two poles in right side of s-plane exist.
 Which one of the following transfer functions is best represented by the above Bode magnitude plot? (SET-1(2016))


 For phase corssover frequency ωphImg[G(jω)] = 0;
 Nyquist plot of the product of G1(s) and G2(s) is (SET-2(2015))
 (b)
(b)  (c)
(c)  (d)
(d)  Ans: (b)
 (a)
(a) 


 now, from the given plot we know type of system is one.

 The maximum phase angle ϕm and the corresponding gain Gm respectively, are (SET-3(2014))
 ∴ Transfer function of given system is given by
 As α < 1, therefore the transfer function T(s) represents a lead compensator having α = 1/3


