SSC CGL Exam  >  SSC CGL Notes  >  SSC CGL Tier 2 - Study Material, Online Tests, Previous Year  >  Quartile Deviation - Measures of Dispersion, Business Mathematics & Statistics

Quartile Deviation - Measures of Dispersion, Business Mathematics & Statistics | SSC CGL Tier 2 - Study Material, Online Tests, Previous Year PDF Download

QUARTILE DEVIATION 
Quartiles are such values which divide the total number of observations into 4 equal parts. Obviously, there are 3 quartiles—
(i) First quartile (or Lower quartile): Q1
(ii) Second quartile, (or Middle quartile) : Q2
(iii) Third quartile (or Upper quartile): Q3 
The number of observations smaller than Q, is the same as the number lying between Q1 and Q2, or between Q2 and Q3, or larger than Q3. For data of continuous type, one-quarter of the observations is smaller than Q1, two-quarters are smaller than Q2 , and three-quarters are smaller than Q3. This means that Q1, Q2, Qare values of the variable corresponding to ‘less-than’ cumulative frequencies N/4, 2N/4, 3N/ 4 respectively. Since, 2N/4 = N/2, it is evident that the second quartile Q2 is the same as median.

Q1 < Q2 < Q3 ; Q2 = Median. 
Quartiles are used for measuring central tendency, dispersion and skewness. For instance, the second quartile Q2 is itself taken as a measure of central tendency, where it is known as Median. Quartile deviation is defined as half the difference between the upper and the lower quartiles.

Quartile Deviation - Measures of Dispersion, Business Mathematics & Statistics | SSC CGL Tier 2 - Study Material, Online Tests, Previous Year
The difference Q3- Q1 being the distance between the quartiles can also be called inter quartile range; half of this Semi- inter quartile Range. Thus the name ‘Semi - inter quartile Range’ itself gives the definition of Quartile Deviation.

Quartile Deviation (Q.D.) is dependent on the two quartiles and does not take into account the variability of the largest 25% or the smallest 25% of observations. It is therefore unaffected by extreme values. Since in most cases the central 50% of observation tend to be fairly typical, Q.D. affords a convenient measure of dispersion. It can be calculated from frequency distributions with open-end classes. Q.D. is thus superior to Range in many ways. Its unpopularity lies in the fact that Q.D. does not depend on the magnitudes of all observations. The calculation of Q.D. only depends on that of the two quartiles, Q1 and Q3 which can be found from a cumulative frequency distribution using simple interpolation.

Example and Solution.
Example 1. Calculate the quartile deviation from the following:
Quartile Deviation - Measures of Dispersion, Business Mathematics & Statistics | SSC CGL Tier 2 - Study Material, Online Tests, Previous Year
Solution. In order to compute Quartile Deviation, we have to find QI and Q3 i.e. values of the variable corresponding to Cumulative frequencies N/4 and 3N/4. Here, total frequency N = 82. Therefore, N/4 = 20.5 and 3N/4 = 61.5 

Quartile Deviation - Measures of Dispersion, Business Mathematics & Statistics | SSC CGL Tier 2 - Study Material, Online Tests, Previous Year

Quartile Deviation - Measures of Dispersion, Business Mathematics & Statistics | SSC CGL Tier 2 - Study Material, Online Tests, Previous Year

Quartile Deviation - Measures of Dispersion, Business Mathematics & Statistics | SSC CGL Tier 2 - Study Material, Online Tests, Previous Year


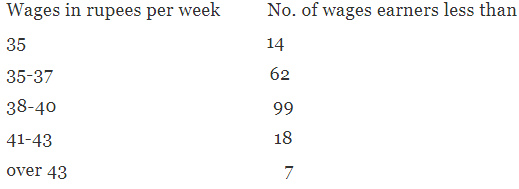
Example 2. Calculate the appropriate measure of dispersion from the following data :
Quartile Deviation - Measures of Dispersion, Business Mathematics & Statistics | SSC CGL Tier 2 - Study Material, Online Tests, Previous Year
Solution. Since there are open-end classes in the frequency distribution. Quartile deviation would be the most appropriate measure of dispersion for the data. So, we have to determine the quartiles QI and Q3 which can be done from cumulative frequency distribution using simple interpolation.

Quartile Deviation - Measures of Dispersion, Business Mathematics & Statistics | SSC CGL Tier 2 - Study Material, Online Tests, Previous Year

Applying Simple interpolation,

Quartile Deviation - Measures of Dispersion, Business Mathematics & Statistics | SSC CGL Tier 2 - Study Material, Online Tests, Previous YearQuartile Deviation - Measures of Dispersion, Business Mathematics & Statistics | SSC CGL Tier 2 - Study Material, Online Tests, Previous Year
Quartile Deviation - Measures of Dispersion, Business Mathematics & Statistics | SSC CGL Tier 2 - Study Material, Online Tests, Previous Year

Example 3. Consider the following scores of 10 CFA Level 1 candidates
78   56   67   51   43   89   57   67   78   50
Solution. Range = 89 – 43 = 46

Example 4. 6 Investment analysts attain the following returns on six different investments:
{12%   4%   23%   8%   9%   16%}
Calculate the mean absolute deviation and interpret it.
Solution. First, we have to calculate the arithmetic mean:
Quartile Deviation - Measures of Dispersion, Business Mathematics & Statistics | SSC CGL Tier 2 - Study Material, Online Tests, Previous Year
Next, we can now compute the MAD:
Quartile Deviation - Measures of Dispersion, Business Mathematics & Statistics | SSC CGL Tier 2 - Study Material, Online Tests, Previous Year
= 30/6
= 5%
Interpretation: It means that on average, an individual return deviates 5% from the mean return of 12%

Example 5. Working with data from example 2 above, the variance will be calculated as follows:
Solution.
Quartile Deviation - Measures of Dispersion, Business Mathematics & Statistics | SSC CGL Tier 2 - Study Material, Online Tests, Previous Year
Thus, the average variation from the mean (0.12) is 0.003767.
The standard deviation is 0.0037671/2 = 0.06137 or 6.14%
Analysts use the standard deviation to interpret returns as opposed to the variance since it is much easier to comprehend.

Example 6. Assume that the returns realized in example 2 above were sampled from a population comprising 100 returns. Compute the sample mean and the corresponding sample variance.
Solution. The sample mean will still be 12%
Hence,
Quartile Deviation - Measures of Dispersion, Business Mathematics & Statistics | SSC CGL Tier 2 - Study Material, Online Tests, Previous Year
Therefore,
Quartile Deviation - Measures of Dispersion, Business Mathematics & Statistics | SSC CGL Tier 2 - Study Material, Online Tests, Previous Year

The document Quartile Deviation - Measures of Dispersion, Business Mathematics & Statistics | SSC CGL Tier 2 - Study Material, Online Tests, Previous Year is a part of the SSC CGL Course SSC CGL Tier 2 - Study Material, Online Tests, Previous Year.
All you need of SSC CGL at this link: SSC CGL
1365 videos|1312 docs|1010 tests

Top Courses for SSC CGL

FAQs on Quartile Deviation - Measures of Dispersion, Business Mathematics & Statistics - SSC CGL Tier 2 - Study Material, Online Tests, Previous Year

1. What is quartile deviation and how is it calculated?
Ans. Quartile deviation is a measure of dispersion that shows the spread or variability of data in a distribution. It is calculated by subtracting the first quartile (Q1) from the third quartile (Q3) and then dividing the result by 2.
2. How is quartile deviation different from range and standard deviation?
Ans. Quartile deviation, range, and standard deviation are all measures of dispersion, but they capture different aspects of the data. Range simply measures the difference between the highest and lowest values, while quartile deviation takes into account the spread within the middle 50% of the data. Standard deviation, on the other hand, considers the dispersion of the entire data set and is influenced by outliers.
3. Can quartile deviation be negative?
Ans. No, quartile deviation cannot be negative. Since it is calculated by subtracting the first quartile from the third quartile, the result will always be a positive value. A negative quartile deviation would not make sense in the context of measuring variability.
4. What does a high quartile deviation indicate?
Ans. A high quartile deviation indicates a large spread or variability in the middle 50% of the data. This means that the values in the dataset are widely dispersed around the median. It suggests that there is a significant difference between the upper quartile and lower quartile, indicating a diverse range of values within the dataset.
5. How is quartile deviation useful in business statistics?
Ans. Quartile deviation is useful in business statistics as it provides a measure of variability within the middle 50% of the data. It helps in understanding the spread of values around the median, which is important for decision-making and risk analysis. For example, in finance, quartile deviation can be used to measure the volatility of stock returns, helping investors assess the potential risk associated with a particular investment.
1365 videos|1312 docs|1010 tests
Download as PDF
Explore Courses for SSC CGL exam

Top Courses for SSC CGL

Signup for Free!
Signup to see your scores go up within 7 days! Learn & Practice with 1000+ FREE Notes, Videos & Tests.
10M+ students study on EduRev
Related Searches

Business Mathematics & Statistics | SSC CGL Tier 2 - Study Material

,

mock tests for examination

,

practice quizzes

,

Viva Questions

,

MCQs

,

Business Mathematics & Statistics | SSC CGL Tier 2 - Study Material

,

Previous Year

,

past year papers

,

Objective type Questions

,

Business Mathematics & Statistics | SSC CGL Tier 2 - Study Material

,

Sample Paper

,

Quartile Deviation - Measures of Dispersion

,

Semester Notes

,

Free

,

Online Tests

,

ppt

,

Exam

,

Important questions

,

Online Tests

,

Previous Year Questions with Solutions

,

Quartile Deviation - Measures of Dispersion

,

Previous Year

,

pdf

,

Quartile Deviation - Measures of Dispersion

,

Online Tests

,

video lectures

,

Summary

,

Extra Questions

,

shortcuts and tricks

,

study material

,

Previous Year

;