Class 9 Exam  >  Class 9 Notes  >  RD Sharma Solutions for Class 9 Mathematics  >  RD Sharma Solutions Ex-24.1, (Part - 1), Measures Of Central Tendency, Class 9, Maths

RD Sharma Solutions Ex-24.1, (Part - 1), Measures Of Central Tendency, Class 9, Maths | RD Sharma Solutions for Class 9 Mathematics PDF Download

Q.1: If the heights of 5 persons are 140 cm, 150 cm, 152 cm, 158 cm and 161 cm respectively. Find the mean height.

SOLUTION :

Given : the heights of 5 persons are 140 cm , 150 cm , 152 cm , 158 cm and 161 cm

RD Sharma Solutions Ex-24.1, (Part - 1), Measures Of Central Tendency, Class 9, Maths | RD Sharma Solutions for Class 9 Mathematics


Q 2 . Find the mean of 994 , 996 , 998 , 1000 , 1002.

SOLUTION :

Given :

Numbers are 994 , 996 , 998 , 1000 , 1002.

RD Sharma Solutions Ex-24.1, (Part - 1), Measures Of Central Tendency, Class 9, Maths | RD Sharma Solutions for Class 9 Mathematics

Q 3 . Find the mean of first five natural numbers.

SOLUTION :

The first five odd numbers are 1 , 2 , 3 , 4 , 5.

RD Sharma Solutions Ex-24.1, (Part - 1), Measures Of Central Tendency, Class 9, Maths | RD Sharma Solutions for Class 9 Mathematics


Q 4 . Find the mean of all factors of 10.

SOLUTION :

All factors of 6 are 1 , 2 , 5 , 10.

RD Sharma Solutions Ex-24.1, (Part - 1), Measures Of Central Tendency, Class 9, Maths | RD Sharma Solutions for Class 9 Mathematics

Mean = 4.5


Q 5 . Find the mean of first ten even natural numbers.

SOLUTION :

The first five even natural numbers are 2 , 4 , 6 , 8 , 10 , 12 , 14 , 16 , 18 , 20

RD Sharma Solutions Ex-24.1, (Part - 1), Measures Of Central Tendency, Class 9, Maths | RD Sharma Solutions for Class 9 Mathematics

Mean = 11


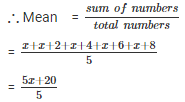
Q 6 . Find the mean of x , x + 2 , x + 4 , x + 6 , x + 8.

SOLUTION :

Numbers are x , x + 2 , x + 4 , x + 6 , x + 8.
RD Sharma Solutions Ex-24.1, (Part - 1), Measures Of Central Tendency, Class 9, Maths | RD Sharma Solutions for Class 9 Mathematics


Q 7. Find the mean of first five multiples of 3.

SOLUTION :

First five multiples of 3 are 3 , 6 , 9 , 12 , 15.

RD Sharma Solutions Ex-24.1, (Part - 1), Measures Of Central Tendency, Class 9, Maths | RD Sharma Solutions for Class 9 Mathematics

= 9

Mean = 9


Q 8 . Following are the weights of 10 new born babies in a hospital on a particular day  : 3.4 , 3 .6 , 4.2 , 4.5 , 3.9 , 4.1 , 3.8 , 4.5 , 4.4 , 3.6 (in kg). Find the mean.

SOLUTION : The weights (in kg) of 10 new born  babies are : 3.4 , 3 .6 , 4.2 , 4.5 , 3.9 , 4.1 , 3.8 , 4.5 , 4.4 , 3.6

RD Sharma Solutions Ex-24.1, (Part - 1), Measures Of Central Tendency, Class 9, Maths | RD Sharma Solutions for Class 9 Mathematics

= 4 kg


Q 9 . The percentage marks obtained by students of a class in mathematics are as follows: 64 , 36 , 47 , 23 , 0 , 19 , 81 , 93 , 72 , 35 , 3 , 1 .Find their mean.

SOLUTION :

The percentage marks obtained by students are 64 , 36 , 47 , 23 , 0 , 19 , 81 , 93 , 72 , 35 , 3 , 1

RD Sharma Solutions Ex-24.1, (Part - 1), Measures Of Central Tendency, Class 9, Maths | RD Sharma Solutions for Class 9 Mathematics

Mean Marks = 39.5


Q 10. The numbers of children in 10 families of a locality  are 2 , 4 , 3 , 4 , 2 , 3 , 5 , 1 , 1 , 5 . Find the number of children per family.

SOLUTION :

The numbers of children  in 10 families  are : 2 , 4 , 3 , 4 , 2 , 3 , 5 , 1 , 1 , 5

RD Sharma Solutions Ex-24.1, (Part - 1), Measures Of Central Tendency, Class 9, Maths | RD Sharma Solutions for Class 9 Mathematics


Q 11 . If M is the mean of x1,x2,x3,x4,xand x6 , Prove that 

(x1−M)+(x2−M)+(x3−M)+(x4−M)+(x5−M)+(x6−M) = 0.

SOLUTION :

Let M be the mean of x1,x2,x3,x4,xand x6

RD Sharma Solutions Ex-24.1, (Part - 1), Measures Of Central Tendency, Class 9, Maths | RD Sharma Solutions for Class 9 Mathematics

= x1+x2+x3+x4+x5+x6 = 6M

To Prove :- (x1−M)+(x2−M)+(x3−M)+(x4−M)+(x5−M)+(x6−M) = 0.

Proof :- L . H . S

= (x1−M)+(x2−M)+(x3−M)+(x4−M)+(x5−M)+(x6−M)

= (x1+x2+x3+x4+x5+x6)−(M+M+M+M+M+M)

= 6M – 6M

= 0

= R . H . S


Q 12 . Duration of sunshine(in hours) in  Amritsar  for first  10 days of August  1997 as reported by the Meterological Department  are given as  follows : 9.6 , 5.2 , 3.5 , 1.5 , 1.6 , 2.4 , 2.6 , 8.4 , 10.3 , 10.9

1. Find the mean  RD Sharma Solutions Ex-24.1, (Part - 1), Measures Of Central Tendency, Class 9, Maths | RD Sharma Solutions for Class 9 Mathematics

2.Verify that  RD Sharma Solutions Ex-24.1, (Part - 1), Measures Of Central Tendency, Class 9, Maths | RD Sharma Solutions for Class 9 Mathematics

SOLUTION :

Duration of sunshine (in hours ) for 10 days are =9.6 , 5.2 , 3.5 , 1.5 , 1.6 , 2.4 , 2.6 , 8.4 , 10.3 , 10.9

RD Sharma Solutions Ex-24.1, (Part - 1), Measures Of Central Tendency, Class 9, Maths | RD Sharma Solutions for Class 9 Mathematics

RD Sharma Solutions Ex-24.1, (Part - 1), Measures Of Central Tendency, Class 9, Maths | RD Sharma Solutions for Class 9 Mathematics

= 56/10 = 5.6

RD Sharma Solutions Ex-24.1, (Part - 1), Measures Of Central Tendency, Class 9, Maths | RD Sharma Solutions for Class 9 Mathematics

RD Sharma Solutions Ex-24.1, (Part - 1), Measures Of Central Tendency, Class 9, Maths | RD Sharma Solutions for Class 9 Mathematics

= (9.6−5.6)+(5.2−5.6)+(3.5−5.6)+(1.5−5.6)+(1.6−5.6)+(2.4−5.6)+(2.6−5.6)+(8.4−5.6)+(10.3−5.6)+(10.9−5.6)

= 4 – 0.4 – 2.1 – 4.1 – 4 – 3.2 – 3 + 2.8 + 4.7 + 5.3

= 16.8 – 16.8 = 0

= R.H.S


The document RD Sharma Solutions Ex-24.1, (Part - 1), Measures Of Central Tendency, Class 9, Maths | RD Sharma Solutions for Class 9 Mathematics is a part of the Class 9 Course RD Sharma Solutions for Class 9 Mathematics.
All you need of Class 9 at this link: Class 9
91 docs

Top Courses for Class 9

FAQs on RD Sharma Solutions Ex-24.1, (Part - 1), Measures Of Central Tendency, Class 9, Maths - RD Sharma Solutions for Class 9 Mathematics

1. What are measures of central tendency in statistics?
Ans. Measures of central tendency are statistical measures that represent the center or typical value of a dataset. These measures include the mean, median, and mode. The mean is the average value of the dataset, the median is the middle value when the data is arranged in ascending or descending order, and the mode is the value that appears most frequently in the dataset.
2. How is the mean calculated for a given dataset?
Ans. The mean is calculated by summing up all the values in the dataset and dividing the sum by the total number of values. Mathematically, the formula for calculating the mean is: Mean = (sum of all values) / (total number of values) For example, if we have a dataset {5, 7, 9, 11, 13}, the mean would be calculated as (5+7+9+11+13)/5 = 9.
3. What is the median and how is it determined in a dataset?
Ans. The median is the middle value in a dataset when the data is arranged in ascending or descending order. To determine the median, the data is first arranged in order, and then the middle value is identified. If the dataset has an odd number of values, the middle value is the median. If the dataset has an even number of values, the median is the average of the two middle values. For example, in the dataset {5, 7, 9, 11, 13}, the median would be 9. In the dataset {5, 7, 9, 11, 13, 15}, the median would be (9+11)/2 = 10.
4. How is the mode determined in a dataset?
Ans. The mode in a dataset is the value that appears most frequently. To determine the mode, we count the frequency of each value in the dataset and identify the value with the highest frequency. It is possible for a dataset to have multiple modes if multiple values have the same highest frequency. For example, in the dataset {5, 7, 9, 9, 11, 13, 13, 13}, the mode would be 13 as it appears three times, which is the highest frequency.
5. How do measures of central tendency help in understanding a dataset?
Ans. Measures of central tendency provide valuable information about the typical or central value of a dataset. The mean, median, and mode help in understanding the average, middle, and most frequently occurring values, respectively. These measures help in summarizing the data, making comparisons, and drawing conclusions. They are also useful in identifying outliers or extreme values that may impact the overall interpretation of the dataset.
91 docs
Download as PDF
Explore Courses for Class 9 exam

Top Courses for Class 9

Signup for Free!
Signup to see your scores go up within 7 days! Learn & Practice with 1000+ FREE Notes, Videos & Tests.
10M+ students study on EduRev
Related Searches

Class 9

,

RD Sharma Solutions Ex-24.1

,

(Part - 1)

,

RD Sharma Solutions Ex-24.1

,

shortcuts and tricks

,

Maths | RD Sharma Solutions for Class 9 Mathematics

,

Objective type Questions

,

Maths | RD Sharma Solutions for Class 9 Mathematics

,

Measures Of Central Tendency

,

ppt

,

(Part - 1)

,

Maths | RD Sharma Solutions for Class 9 Mathematics

,

RD Sharma Solutions Ex-24.1

,

(Part - 1)

,

Semester Notes

,

Viva Questions

,

study material

,

practice quizzes

,

Sample Paper

,

Summary

,

pdf

,

Important questions

,

Class 9

,

Free

,

Measures Of Central Tendency

,

past year papers

,

Previous Year Questions with Solutions

,

video lectures

,

Measures Of Central Tendency

,

mock tests for examination

,

Exam

,

Extra Questions

,

Class 9

,

MCQs

;