Rank Correlation - Correlation & Regression, Business Mathematics & Statistics | SSC CGL Tier 2 - Study Material, Online Tests, Previous Year PDF Download

Rank Correlation Rank method for the computation of the coefficient of correlation is based on the rank or the order & not the magnitude of the variable. Accordingly it is more suitable when the variables can be arranged for e.g. in case of intelligence or beauty or any other qualitative phenomenon. The ranks may range from 1 to n.
Edward spearman has provided the following formula —
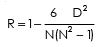
Where N = Number of pairs of variable X & Y
D = Rank difference
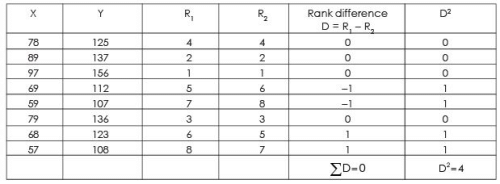
Example 4 : From the data given belows calculate the rank correlation between x & Y

Solution :
Table : Computation of Rank Correlation
Rank correlation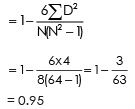
This shows there is very high positive correlation between X & Y.
Example 5 : Calculate Rank Correlation from the following data.

Solution : Table : Calculation of Rank correlation
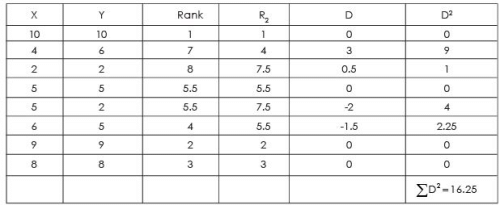
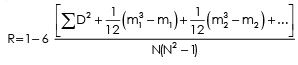
Here m, m2 ... denote the number of times ranks are tied in both the variables, the subscripts & denote the first tie, second tie,...., in both the variables
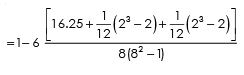
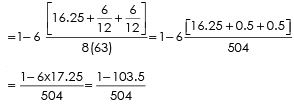
= 1 – 0.205
= 0.795
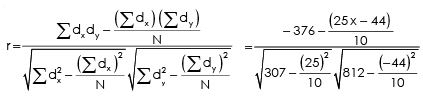
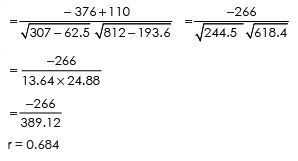
Example 6 : Find the coefficient of correlation between price and sales from the following data :

Solution : Let the value of assumed mean for X(AX) be 90
Let the value of assumed mean for Y(Ay) be 700
Table : Calculation of correlation coefficient
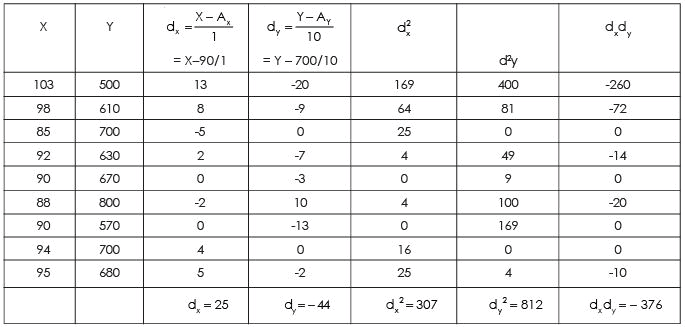
Note : As r is a pure number, change of scale does not affect its value. Hence the values are divided by 10 in column 4 to make the calculations simple. The following formula can be applied to all the problems.
Steps.
(i) find out the direction of change of X variable, i.e., as compared with the first value, whether the second value is increasing or decreasing or is constant. If it is increasing put (+) sign; if it is decreasing put (-) sign (minus) and if it is constant put zero. Similarly, as compared to second value find out whether the third value is increasing, decreasing or constant. Repeat the same process for other values. Denote this column by Dx.
(ii) In the same manner as discussed above find out the direction of change of Y variable and denote this column by Dy.
(iii) Multiply Dx with Dy, and determine the value of c, i.e., the number of positive signs.
(iv) Apply the above formula, i.e.,
rc = +√+ (2C-n)/n
Note. The significance of + signs, both (inside the under root and outside the under root) is that we cannot take the under root of minus sign. Therefore, if 2C-n is negative, this negative n value of multiplied with the minus sign inside would make it positive and we can take the under root. But the ultimate result would be negative. If 2C-n is positive then, of course, we get a positive n value of the coefficient of correlation.
For more help in Concurrent Deviation Method please click the button below to submit your homework assignment.
|
1333 videos|1438 docs|834 tests
|
FAQs on Rank Correlation - Correlation & Regression, Business Mathematics & Statistics - SSC CGL Tier 2 - Study Material, Online Tests, Previous Year
| 1. What is rank correlation? |  |
| 2. How is rank correlation different from other types of correlation? | |
| 3. How is rank correlation calculated? | |
| 4. What does a positive rank correlation coefficient indicate? | |
| 5. Why is rank correlation useful in business mathematics and statistics? | |


Viva Questions
,study material
,Business Mathematics & Statistics | SSC CGL Tier 2 - Study Material
,Previous Year
,shortcuts and tricks
,Extra Questions
,mock tests for examination
,ppt
,Semester Notes
,Business Mathematics & Statistics | SSC CGL Tier 2 - Study Material
,MCQs
,past year papers
,Objective type Questions
,Previous Year
,Important questions
,Online Tests
,Previous Year Questions with Solutions
,Free
,Business Mathematics & Statistics | SSC CGL Tier 2 - Study Material
,Sample Paper
,Online Tests
,Exam
,Online Tests
,video lectures
,Rank Correlation - Correlation & Regression
,Previous Year
,Summary
,practice quizzes
,Rank Correlation - Correlation & Regression
,Rank Correlation - Correlation & Regression
;


Rank Correlation - Correlation & Regression, Business Mathematics & Statistics Free PDF Download
Importance of Rank Correlation - Correlation & Regression, Business Mathematics & Statistics
Rank Correlation - Correlation & Regression, Business Mathematics & Statistics Notes
Rank Correlation - Correlation & Regression, Business Mathematics & Statistics SSC CGL Questions
Study Rank Correlation - Correlation & Regression, Business Mathematics & Statistics on the App
|
© EduRev
|
Education Revolution
|


|


within 7 days!