Relationship between TR MR and AR - Commerce PDF Download
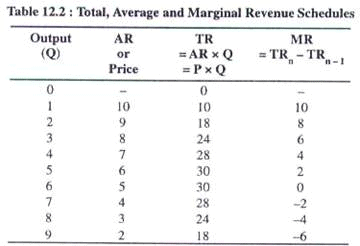
The relationship among total, average and marginal revenues under imperfect competition (all market forms other than pure and perfect completion are cover here) can be explained with the help of a table given below:

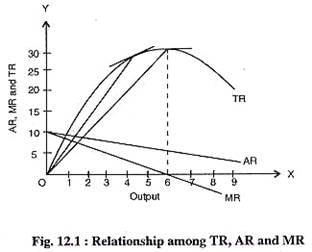
Exactly the same information is given by the total revenue (TR), average revenue (AR) and marginal revenue (MR) curves in Fig. 12.1. These curves have been plotted from the figures in

In the first two columns, we have the data for the demand (or AR) curve. We notice that AR curve is downward sloping, i.e., as price (or AR) falls, quantity demanded and sold increases. In other words, the producer has to reduce the price to sell the additional units of the product.
It can be observed from Table 12.2 and Fig. 12.1 that when AR falls, MR curve lies below it. It means that MR declines at more rapid rate than AR, so that, the gap between AR and MR becomes wider with the increase in output.
Each additional unit sold adds less to the total revenue than the price received for it, since price on all the units must be lowered in order to sell this unit. Thus, the marginal revenue (MR) is equal to the price of the extra unit sold minus the loss from selling all previous units at the new lower price, i.e., MR =Pn+ 1 – (Pn – Pn+1) Qn, where Pn and Qnare the price and quantity sold before the fall in price. Pn +1 is the reduced price. It is evident that at all prices, MR is smaller than AR (price), given that Qn and (Pn– Pn+1) are positive. This is clear from the figures given in the table
As per Table 12.2, TR is zero, when no unit is sold. Further, one unit is sold at a price of Rs. 10. Now, the total revenue of two units is Rs. 9 x 2 = Rs. 18 and the total revenue from the first unit is Rs. 10. Hence, marginal revenue (i.e., addition to total revenue) of the second unit is Rs. 18-Rs. 10 = Rs. 8.
Alternatively, the loss of revenue of Rs. 1 on first unit can be deducted from the price at which the second unit is sold, to get its marginal revenue. This loss is due to the fall in price as a result of the sale of one additional unit. Marginal revenue is, therefore, Rs. 9 – Rs. 1 = Rs. 8. Further, when price declines to Rs. 8, only 3 units are sold and TR increases to Rs. 24.
The increase in TR by selling this unit is Rs. 6, which is the MR of the third unit. Alternatively, MR of the third unit can be obtained by subtracting Rs. 2 (total loss of revenue on first two units) from Rs. 8 (the price of the third unit).
Again, MR is the same, i.e. Rs. 6. In the same way, MR of the other units can be calculated. We, thus, observe that with the increase in sales, price falls and marginal revenue is less than the price (or AR). That is why, the MR curve lies below the AR curve and declines at a faster rate
It is important to note that the falling MR curve bisects the distance on the X-axis between the point of origin and the point, where the AR curve touches the X-axis in two equal parts. But, this relationship will not hold true, if the AR curve is not a straight line that slopes downward.
It may be further observed that so long as the TR is increasing, MR is positive. In Fig. 12.1, MR is positive for the first five units. Thus, TR curve starting from the origin continues to increase up to five units. TR does not change between fifth and sixth unit.
When TR is unaffected by the increase in quantity, MR is equal to zero. TR is maximum corresponding to zero MR at the sixth unit. Beyond sixth unit, TR falls and MR becomes negative. MR of the seventh unit is – 2 and that of eighth unit is – 4. Thus, while AR is always positive. MR can be positive, zero or even negative.
The relationship among TR, AR and MR can be summarised as follows:
(i) Initially, TR (i.e., price x units of the commodity sold) increases at a diminishing rate with increase in the units of output, since more units of the commodity can only be sold at a lower price, such that MR is positive and is downward sloping.
(ii) When TR is maximum MR becomes equal to zero.
(iii) MR becomes negative, when TR decreases with increase in the units of output.
(iv) MR falls with the fall in AR, but, the rate of decrease in MR is much higher than that in AR.
(v) MR may be positive, negative or zero, but AR is always positive (since negative price is absurd)
FAQs on Relationship between TR MR and AR - Commerce
| 1. What is the relationship between Total Revenue (TR), Marginal Revenue (MR), and Average Revenue (AR)? |  |
| 2. How are Total Revenue (TR) and Marginal Revenue (MR) related when a firm is operating in a perfectly competitive market? |  |
| 3. What is the relationship between Marginal Revenue (MR) and Average Revenue (AR) when a firm is a monopoly? |  |
| 4. How do changes in price affect Total Revenue (TR), Marginal Revenue (MR), and Average Revenue (AR) in a monopolistic market? |  |
| 5. How can a firm maximize its Total Revenue (TR) in a monopolistic market? |  |


