Class 9 Maths Chapter 13 Question Answers - Statistics

Question 1. Find the mean of: 10, 90, 20, 80, 30 and 70.
Solution: Number of observations = 6 Sum of the observations = 10 + 90 + 20 + 80 + 30 + 70 = 300
∴ Mean = (300/6)= 50
Thus, the required mean = 50
Question 2. Find the range and prepare a frequency table for the following observations:
4, 1, 1, 2, 3, 5, 2, 3, 3, 1, 2, 2, 4, 2, 5, 4, 1, 1, 3, 2
Solution: Arranging the observations in an ascending order:
1, 1, 1, 1, 1, 2, 2, 2, 2, 2, 2, 3, 3, 3, 3, 4, 4, 4, 5, 5
Lowest observation = 1
Highest observation = 5
∴ Range = 5 – 1 = 4
Thus, the required range = 4.
Frequency table:
Observation | Tally marks | Frequency |
1 |
| 5 |
2 |
| 6 |
3 | IIII | 4 |
4 | III | 3 |
5 | II | 2 |


Question 3. Make a cumulative frequency table for the following:
Class interval | Tally marks | Frequency |
100-110 | IIII | 4 |
110-120 |
| 6 |
120-130 | II | 2 |
130-140 | III | 3 |
140-150 |
| 5 |
Total | 20 | |


Solution: Cumulative frequency table:
Class interval | Tally marks | Frequency | Cumulative frequency |
100-110 | IIII | 4 | 4 |
110-120 |
| 6 | 6 + 4 = 10 |
120-130 | II | 2 | 10 + 2 = 12 |
130-140 | III | 3 | 12 + 3 = 15 |
140-150 |
| 5 | 15 + 5 = 20 |
Total | 20 | ||


Question 4. Form a frequency table for the following:
| Marks obtained | Number of students |
| More than 50 More than 40 More than 30 More than 20 More than 10 More than 0 | 0 20 37 44 46 50 |
Solution:
| Marks obtained | Frequency | Cumulative frequency |
| 0–10 10–20 20–30 30–40 40–50 | 50 – 46 = 4 46 – 44 = 2 44 – 37 = 7 37 – 20 = 17 20 – 0 = 20 | 4 6 13 30 50 |
| Total | 50 |
Question 5. Find the mean of the first six multiples of 6.
Solution: Six multiples of 6 are: 6, 12, 18, 24, 30, 36

Thus, the required mean = 21
Question 6. If the mean of 8, 5, 2, x, 6, 5 is 6, then find the value of x.
Solution: We have the number of observations = 6
∴ Mean = 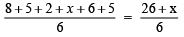
Now,  [∵ Mean is 6]
⇒ 26 + x = 6 x 6 ⇒ x = 36 – 26 = 10
Question 7. If the mean of the following data is 15 then find the value of p.
| xi | 5 | 10 | 15 | 20 | 25 |
| fi | 6 | 4 | 5 | p | 7 |
Solution: We can have the following table from the given data :
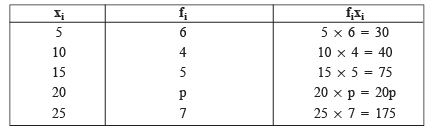
∴ we have ∑ (fi) = 6+4+5+p+7 = 22+p
∑ (xifi) = 30+40+75+20p+175 = 320+20p
∵ Mean, 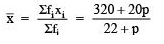
But Mean = 15
∴ 
⇒ 320 + 20p = 15(22 + p)
⇒ 320 + 20p = 330 + 15p
⇒ 20p – 15p = 330 – 320
⇒ 5p = 10
⇒ p= (10/5)= 2
Thus, the required value of p is 2
Question 8. If the mean of the following data is 18.75, find the value of p:
| xi | 10 | 15 | 20 | p | 30 |
| fi | 5 | 10 | 7 | 8 | 2 |
Solution: From the given data we can prepare the following table:
xi | fi | (fi * xi) |
10 | 5 | 10 x 5 = 50 |
15 | 10 | 15 x 10 = 150 |
20 | 7 | 20 x 7 = 140 |
P | S | p x 8 = 8p |
30 | 2 | 30 x 2 = 60 |
| ∑(fi) = 32 | ∑(xi * fi) = 400 + 8p |
∵ 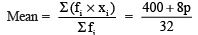
But the mean is 18.75.
∴ 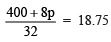
⇒ 400 + 8p = 18.75 x 32
⇒ 400 + 8p = 600
⇒ 8p = 600 – 400 = 200
⇒ p= (200/8) = 25
Thus, the required value of p is 25.
Question 9. The following observations are arranged in ascending order:
26, 29, 42, 53, x, x + 2, 70, 75, 82, 93
If the median is 65, find the value of x.
Solution: Number of observations (n) = 10 Here ‘n’ is even
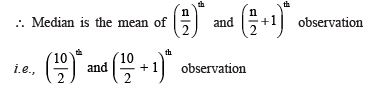
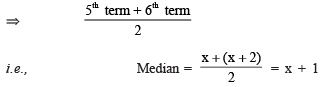
∴ x + 1 = 65 or x = 65 – 1 = 64
Thus, the required value of x is 64.
Question 10. Construct a frequency table with equal class intervals from the following data on the monthly wages (in rupees) of 30 workers of a factory taking one of the class interval as 8440–8540 (8540 not included). 8740, 8780, 8760, 8740, 8450, 8200, 8440, 9080, 8880, 8840, 8340, 8140, 8660, 8960, 8400, 9100, 8460, 8880, 8540, 8140, 8760, 8300, 8350, 8660, 8950, 9120, 9100, 8320, 8150, 9080.
Solution: Here, the lowest observation = 8140
The highest observation = 9120
∵ One of the classes is 8440–8540,
i.e. the class size = 100
∴ To cover the given data, we have the classes as: 8140–8240; 8240–8340; ….; 9040–9140.
Now, the required frequency table is:
Wages (in f) | Tally marks | Frequency |
8140-8240 | IIII | 4 |
8240-8340 | II | 2 |
8340-8440 | III | 3 |
8440-8540 | III | 3 |
8540-8640 | I | 1 |
8640-8740 | II | 2 |
8740-8840 |
| 5 |
8840-8940 | III | 3 |
8940-9040 | III | 3 |
9040-9140 | IIII | 4 |
Total | 30 | |

Question 11. The mean of 40 numbers was found to be 35. Later on, it was detected that a number 56 was misread as 16. Find the correct mean of the given numbers.
Solution: Number of observations = 40
∵ Calculated mean = 35
∴ Calculated sum = 40 x 35 = 1400
Since the number 56 is misread as 16.
∴ Correct sum of the numbers = 1400 – [Wrong observation] + [Correct observation]
= 1400 – [16] + [56]
= (1400 – 16 + 56) = 1440
∴ The correct mean =
= (14440/40)= 36
Thus, the correct mean = 36.
Question 12. The mean of 72 items was found to be 63. If two of the items were misread as 27 and 9 instead of 72 and 90 respectively. Find the correct mean.
Solution: Number of items = 72
Calculated mean = 63
∴ Calculated sum = 72 x 63 = 4536
Since, the item 72 is misread as 27.
And the item 90 is misread as 9.
∴ Correct sum of 72 items = [Calculated sum] – [Sum of the wrong items] + [Sum of the correct items]
= [4536] – [27 + 9] + [72 + 90] = [4536] – [36] + [162]
= [4536 – 36 + 162] = 4662
∴ Correct mean 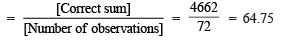
Thus, the required correct mean is 64.75.
Question 13. A train travels between two stations x and y. While going from x to y, its average speed is 72 km per hour, and while coming back from y to x, its average speed is 63 km per hour. Find the average speed of the train during the whole journey.
Solution: Let the distance between x and y is s km.
Since, average speed = Total Distance / Total Time
For the train going from x to y, Average speed = 72 km/hr
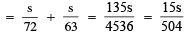
∴ Time taken = Distance / speed = s/72 hours
For the train coming back from y to x, Average speed = 63 km/hr
∴ Time taken = Distance / speed = s/63 hours
Now, the total time taken to cover 2s km
∴ Average speed during the whole journey 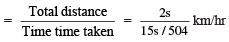
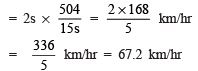
Thus, the required average speed = 67.2 km/hr.
Question 14. Find the mode for the following data using the relation: mode = (3 median – 2 mean)
| Item (x) | Frequency (f) |
| 16 17 18 19 20 21 | 1 1 3 4 1 2 |
| Item (x) | Frequency (f) | Cumulative frequency | fx |
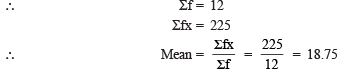
16 17 18 19 20 21 | 1 1 3 4 1 2 | 1 2 5 9 10 12 | 16 17 54 76 20 42 |
| Total | 225 |
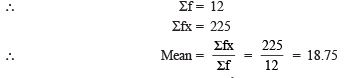
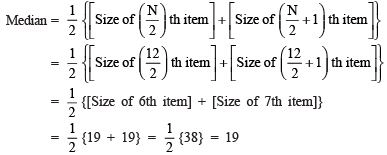
Since, Mode = 3(Median) – 2(Mean)
∴ Mode of the above data = 3(19) – 2(18.75)
= 57 – 37.5 = 19.5
|
40 videos|470 docs|56 tests
|
FAQs on Class 9 Maths Chapter 13 Question Answers - Statistics
| 1. What is statistics? |  |
| 2. What are the two main types of statistics? | |
| 3. What is the importance of statistics in everyday life? | |
| 4. What is the difference between qualitative and quantitative data? | |
| 5. How is statistics used in research? | |


ppt
,Exam
,Previous Year Questions with Solutions
,Viva Questions
,Important questions
,Class 9 Maths Chapter 13 Question Answers - Statistics
,Class 9 Maths Chapter 13 Question Answers - Statistics
,study material
,MCQs
,video lectures
,Sample Paper
,Free
,mock tests for examination
,Objective type Questions
,Class 9 Maths Chapter 13 Question Answers - Statistics
,past year papers
,Summary
,shortcuts and tricks
,Semester Notes
,practice quizzes
,Extra Questions
;


Short Answers Type Questions: Statistics Free PDF Download
Importance of Short Answers Type Questions: Statistics
Short Answers Type Questions: Statistics Notes
Short Answers Type Questions: Statistics Class 9
Study Short Answers Type Questions: Statistics on the App
|
© EduRev
|
Education Revolution
|


|


within 7 days!