Year 11 Exam > Year 11 Notes > Physics for GCSE/IGCSE > Speed-Time Graphs
Speed-Time Graphs | Physics for GCSE/IGCSE - Year 11 PDF Download
Speed-Time Graphs
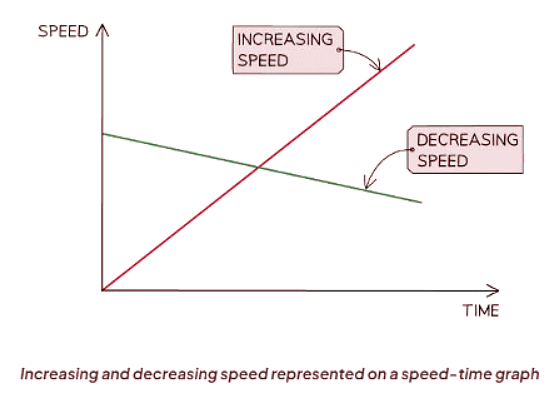
A speed-time graph demonstrates how the speed of a moving object changes over time.
- The red line on a speed-time graph signifies an object undergoing acceleration.
- Conversely, the green line on the graph represents an object decelerating.

Acceleration on a Speed-Time Graph
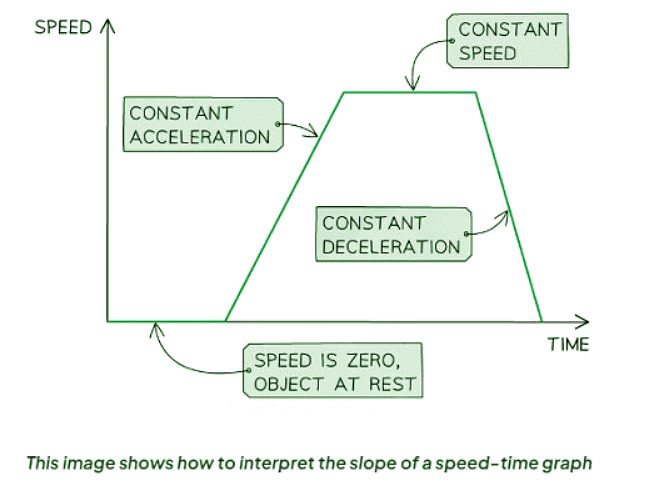
- Constant acceleration or deceleration is indicated by speed-time graphs.
- The value of acceleration or deceleration magnitude is depicted.
- A constant acceleration is symbolized by a straight line.
- The degree of slope on the line indicates the magnitude of acceleration.
- A steep slope signifies a significant acceleration (or deceleration), implying rapid speed changes.
- A gentle slope suggests a minor acceleration (or deceleration), indicating gradual speed adjustments.
- A flat line indicates zero acceleration, meaning the object maintains a constant speed.

Using Speed-Time Graphs
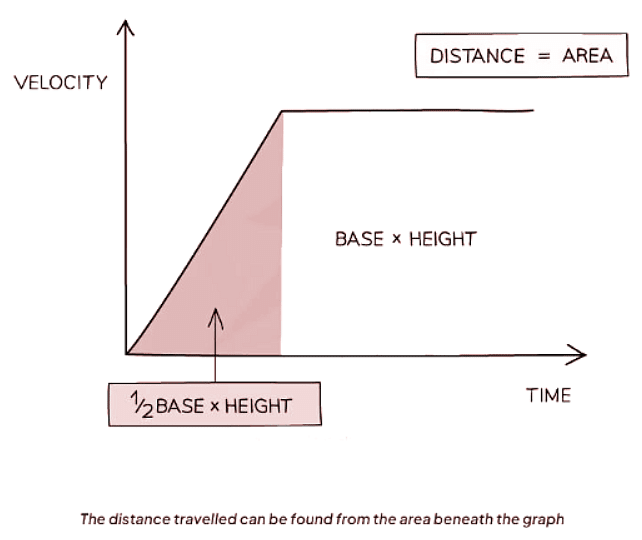
- The concept of finding the distance traveled by an object using the area beneath a speed-time graph is fundamental.

- When the area beneath the graph forms a triangle, indicating acceleration or deceleration, a specific formula can be applied to determine the area.

- In cases where the area beneath the graph forms a rectangle, representing constant velocity, a separate formula is utilized to calculate the area.

Question for Speed-Time GraphsTry yourself: What does a flat line on a speed-time graph indicate?View Solution
The document Speed-Time Graphs | Physics for GCSE/IGCSE - Year 11 is a part of the Year 11 Course Physics for GCSE/IGCSE.
All you need of Year 11 at this link: Year 11
|
127 videos|148 docs|35 tests
|
FAQs on Speed-Time Graphs - Physics for GCSE/IGCSE - Year 11
| 1. How can speed-time graphs be used to analyze motion? |  |
Ans. Speed-time graphs can be used to analyze motion by showing how an object's speed changes over time. The slope of the graph indicates the acceleration or deceleration of the object, while the area under the graph represents the distance traveled.
| 2. What does a horizontal line on a speed-time graph represent? |  |
Ans. A horizontal line on a speed-time graph represents a constant speed. This means that the object is moving at a consistent rate without accelerating or decelerating.
| 3. How can you determine the distance traveled from a speed-time graph? |  |
Ans. To determine the distance traveled from a speed-time graph, you can calculate the area under the graph. This can be done by finding the area of each section of the graph (such as triangles or rectangles) and adding them together.
| 4. What does a steeper slope on a speed-time graph indicate? |  |
Ans. A steeper slope on a speed-time graph indicates a greater acceleration or deceleration of the object. This means that the object is changing speed more rapidly over a given time period.
| 5. How can you calculate the acceleration from a speed-time graph? |  |
Ans. To calculate the acceleration from a speed-time graph, you can find the slope of the graph at any given point. The steeper the slope, the greater the acceleration. You can also calculate the average acceleration by dividing the change in speed by the time interval.

|
Explore Courses for Year 11 exam
|

|
Signup for Free!
Signup to see your scores go up within 7 days! Learn & Practice with 1000+ FREE Notes, Videos & Tests.
Related Searches


