States of Matter - 2 | Chemistry for ACT PDF Download
Behaviour of real gases: Deviation from ideal gas behaviour
Our theoritical model of gases corresponds very well with the experimental observations. Difficulty arises when we try to test how far the relation pV = nRT reproduce actual pressure-volume-temperature relationship of gases. To test this point we plot pV vs p plot of gases because at constant temperature, pV will be constant (Boyle’s law) and pV vs p graph at all pressures will be a straight line parallel to x-axis. Fig. 5.10 shows such a plot constructed from actual data for several gases at 273 K.
It can be seen easily that at constant temperature pV vs p plot for real gases is not a straight line. There is a significant deviation from ideal behaviour. Two types of curves are seen. In the curves for dihydrogen and helium, as the pressure increases the value of pV also increases. The second type of plot is seen in the case of other gases like carbon monoxide and methane. In these plots first there is a negative deviation from ideal behaviour, the pV value decreases with increase in pressure and reaches to a minimum value characteristic of a gas. After that pV value starts increasing. The curve then crosses the line for ideal gas and after that shows positive deviation continuously. It is thus, found that real gases do not follow ideal gas equation perfectly under all conditions.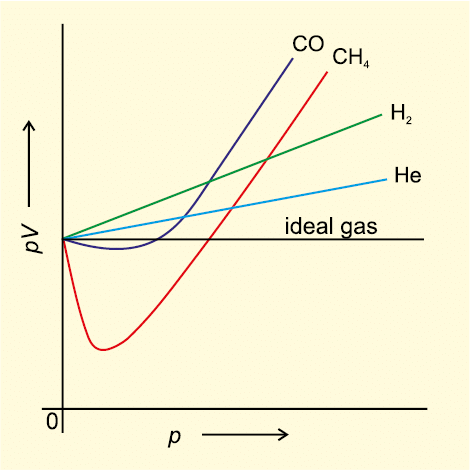
Fig. 5.10 Plot of pV vs p for real gas and ideal gas
Deviation from ideal behaviour also becomes apparent when pressure vs volume plot is drawn. The pressure vs volume plot of experimental data (real gas) and that theoretically calculated from Boyle’s law (ideal gas) should coincide. Fig 5.11 shows these plots. It is apparent that at very high pressure the measured volume is more than the calculated volume. At low pressures, measured and calculated volumes approach each other.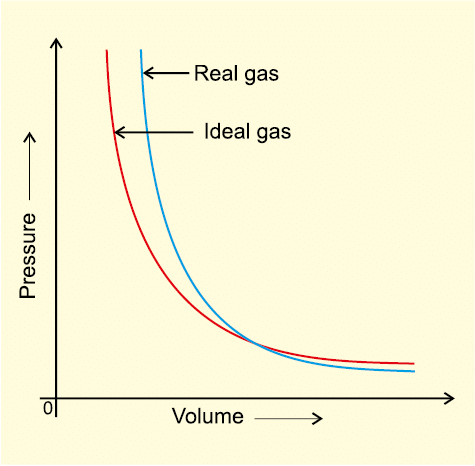
Fig. 5.11 Plot of pressure vs volume for real gas and ideal gas.
It is found that real gases do not follow, Boyle’s law, Charles law and Avogadro law perfectly under all conditions. Now two questions arise.
(i) Why do gases deviate from the ideal behaviour?
(ii) What are the conditions under which gases deviate from ideality?
We get the answer of the first question if we look into postulates of kinetic theory once again. We find that two assumptions of the kinetic theory do not hold good. These are
(a) There is no force of attraction between the molecules of a gas.
(b) Volume of the molecules of a gas is negligibly small in comparison to the space occupied by the gas.
If assumption (a) is correct, the gas will never liquify. However, we know that gases do liquify when cooled and compressed. Also, liquids formed are very difficult to compress. This means that forces of repulsion are powerful enough and prevent squashing of molecules in tiny volume. If assumption (b) is correct, the pressure vs volume graph of experimental data (real gas) and that theoritically calculated from Boyles law (ideal gas) should coincide.
Real gases show deviations from ideal gas law because molecules interact with each other. At high pressures molecules of gases are very close to each other. Molecular interactions start operating. At high pressure, molecules do not strike the walls of the container with full impact because these are dragged back by other molecules due to molecular attractive forces. This affects the pressure exerted by the molecules on the walls of the container. Thus, the pressure exerted by the gas is lower than the pressure exerted by the ideal gas.
Here, a is a constant. Repulsive forces also become significant. Repulsive interactions are short-range interactions and are significant when molecules are almost in contact. This is the situation at high pressure. The repulsive forces cause the molecules to behave as small but impenetrable spheres. The volume occupied by the molecules also becomes significant because instead of moving in volume V, these are now restricted to volume (V–nb) where nb is approximately the total volume occupied by the molecules themselves. Here, b is a constant. Having taken into account the corrections for pressure and volume, we can rewrite equation (5.17) as
Equation (5.31) is known as van der Waals equation. In this equation n is number of moles of the gas. Constants a and b are called van der Waals constants and their value depends on the characteristic of a gas. Value of ‘a’ is measure of magnitude of intermolecular attractive forces within the gas and is independent of temperature and pressure.
Also, at very low temperature, intermolecular forces become significant. As the molecules travel with low average speed, these can be captured by one another due to attractive forces. Real gases show ideal behaviour when conditions of temperature and pressure are such that the intermolecular forces are practically negligible. The real gases show ideal behaviour when pressure approaches zero. The deviation from ideal behaviour can be measured in terms of compressibility factor Z, which is the ratio of product pV and nRT. Mathematically
For ideal gas Z = 1 at all temperatures and pressures because pV = n RT. The graph of Z vs p will be a straight line parallel to pressure axis (Fig. 5.12, page 152). For gases which deviate from ideality, value of Z deviates from unity. At very low pressures all gases shown have Z ≈1 and behave as ideal gas. At high pressure all the gases have Z > 1. These are more difficult to compress.
At intermediate pressures, most gases have Z < 1. Thus gases show ideal behaviour when the volume occupied is large so that the volume of the molecules can be neglected in comparison to it. In other words, the behaviour of the gas becomes more ideal when pressure is very low. Upto what pressure a gas will follow the ideal gas law, depends upon nature of the gas and its temperature. The temperature at which a real gas obeys ideal gas law over an appreciable range of pressure is called Boyle temperature or Boyle point.
Boyle point of a gas depends upon its nature. Above their Boyle point, real gases show positive deviations from ideality and Z values are greater than one. The forces of attraction between the molecules are very feeble.
Below Boyle temperature real gases first show decrease in Z value with increasing pressure, which reaches a minimum value. On further increase in pressure, the value of Z increases continuously. Above explanation shows that at low pressure and high temperature gases show ideal behaviour. These conditions are different for different gases.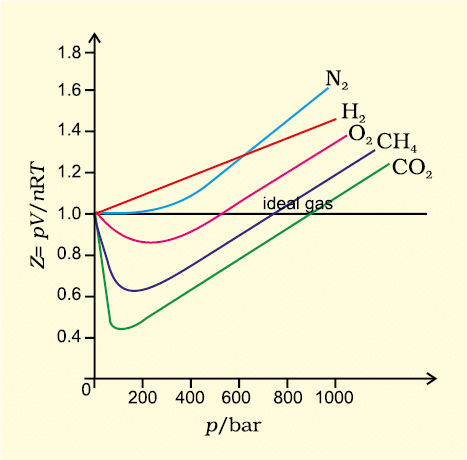
Fig. 5.12 Variation of compressibility factor for some gases
More insight is obtained in the significance of Z if we note the following derivation
If the gas shows ideal behaviour then  . On putting this value of
  in equation (5.33) we have
  (5.34)
From equation (5.34) we can see that compressibility factor is the ratio of actual molar volume of a gas to the molar volume of it, if it were an ideal gas at that temperature and pressure. In the following sections we will see that it is not possible to distinguish between gaseous state and liquid state and that liquids may be considered as continuation of gas phase into a region of small volumes and very high molecular attraction. We will also see how we can use isotherms of gases for predicting the conditions for liquifaction of gases.
Liquifaction of Gases
First complete data on pressure-volume- temperature relations of a substance in both gaseous and liquid state was obtained by Thomas Andrews on Carbon dioxide. He plotted isotherms of carbon dioxide at various temperatures (Fig. 5.13). Later on it was found that real gases behave in the same manner as carbon dioxide. Andrews noticed that at high temperatures isotherms look like that of an ideal gas and the gas cannot be liquified even at very high pressure. As the temperature is lowered, shape of the curve changes and data show considerable deviation from ideal behaviour.
- At 30.98°C carbon dioxide remains gas upto 73 atmospheric pressure. (Point E in Fig. 5.13). At 73 atmospheric pressure, liquid carbon dioxide appears for the first time. The temperature 30.98°C is called critical temperature (TC) of carbon dioxide. This is the highest temperature at which liquid carbon dioxide is observed. Above this temperature it is gas. Volume of one mole of the gas at critical temperature is called critical volume (VC) and pressure at this temperature is called critical pressure (pC). The critical temperature, pressure and volume are called critical constants. Further increase in pressure simply compresses the liquid carbon dioxide and the curve represents the compressibility of the liquid.
- The steep line represents the isotherm of liquid. Even a slight compression results in steep rise in pressure indicating very low compressibility of the liquid. Below 30.98 °C, the behaviour of the gas on compression is quite different. At 21.5 °C, carbon dioxide remains as a gas only upto point B. At point B, liquid of a particular volume appears. Further compression does not change the pressure. Liquid and gaseous carbon dioxide coexist and further application of pressure results in the condensation of more gas until the point C is reached.
- At point C, all the gas has been condensed and further application of pressure merely compresses the liquid as shown by steep line. A slight compression from volume V2 to V3 results in steep rise in pressure from p2 to p3 (Fig. 5.13). Below 30.98 °C (critical temperature) each curve shows the similar trend. Only length of the horizontal line increases at lower temperatures. At critical point horizontal portion of the isotherm merges into one point. Thus we see that a point like A in the Fig. 5.13 represents gaseous state. A point like D represents liquid state and a point under the dome shaped area represents existence of liquid and gaseous carbon dioxide in equilibrium.
- All the gases upon compression at constant temperature (isothermal compression) show the same behaviour as shown by carbon dioxide. Also above discussion shows that gases should be cooled below their critical temperature for liquification. Critical temperature of a gas is highest temperature at which liquifaction of the gas first occurs. Liquifaction of so called permanent gases (i.e., gases which show continuous positive deviation in Z value) requires cooling as well as considerable compression. Compression brings the molecules in close vicinity and cooling slows down the movement of molecules therefore, intermolecular interactions may hold the closely and slowly moving molecules together and the gas liquifies.
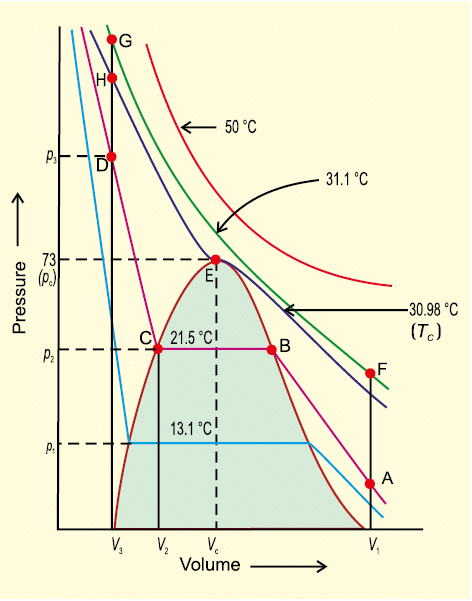
Fig. 5.13 Isotherms of carbon dioxide at various temperatures
- It is possible to change a gas into liquid or a liquid into gas by a process in which always a single phase is present. For example in Fig. 5.13 we can move from point A to F vertically by increasing the temperature, then we can reach the point G by compressing the gas at the constant temperature along this isotherm (isotherm at 31.1°C). The pressure will increase. Now we can move vertically down towards D by lowering the temperature. As soon as we cross the point H on the critical isotherm we get liquid.
- We end up with liquid but in this series of changes we do not pass through two-phase region. If process is carried out at the critical temperature, substance always remains in one phase. Thus there is continuity between the gaseous and liquid state. The term fluid is used for either a liquid or a gas to recognise this continuity.
- Thus a liquid can be viewed as a very dense gas. Liquid and gas can be distinguished only when the fluid is below its critical temperature and its pressure and volume lie under the dome, since in that situation liquid and gas are in equilibrium and a surface separating the two phases is visible. In the absence of this surface there is no fundamental way of distinguishing between two states. At critical temperature, liquid passes into gaseous state imperceptibly and continuously; the surface separating two phases disappears (Section 5.11.1).
- A gas below the critical temperature can be liquified by applying pressure, and is called vapour of the substance. Carbon dioxide gas below its critical temperature is called carbon dioxide vapour. Critical constants for some common substances are given in Table 5.4.
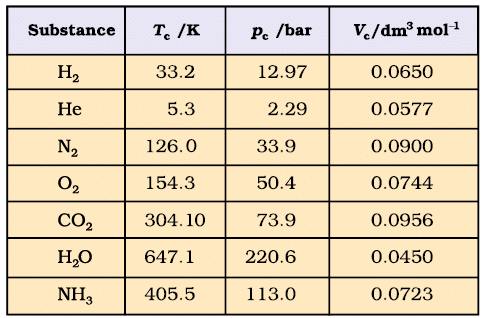
Table 5.4 Critical Constants for Some Substances
|
110 videos|125 docs|115 tests
|


