Thinking, Braking & Stopping Distances | Physics for Grade 10 PDF Download
| Table of contents |

|
| Thinking & Braking Distances |

|
| Estimating Stopping Distances |

|
| Graphs Relating Speed to Stopping Distance |

|
| Solved Example |

|
| Measuring Reaction Time |

|
Thinking & Braking Distances
- The stopping distance of a car is defined as:
- The total distance travelled during the time it takes for a car to stop in response to some emergency
- It can be written as an equation involving two distances:
Stopping distance = Thinking distance + Braking distance - Where:
- Thinking distance = the distance travelled in the time it takes the driver to react (reaction time) in metres (m)
- Braking distance = the distance travelled under the braking force in metres (m)
- Stopping distance = the sum of the thinking distance and braking distance, in metres (m)
- For a given braking force, the greater the speed of the vehicle, the greater the stopping distance
Estimating Stopping Distances
- For a given braking force, the speed of a vehicle determines the size of the stopping distance
- The greater the speed of the vehicle, the larger the stopping distance
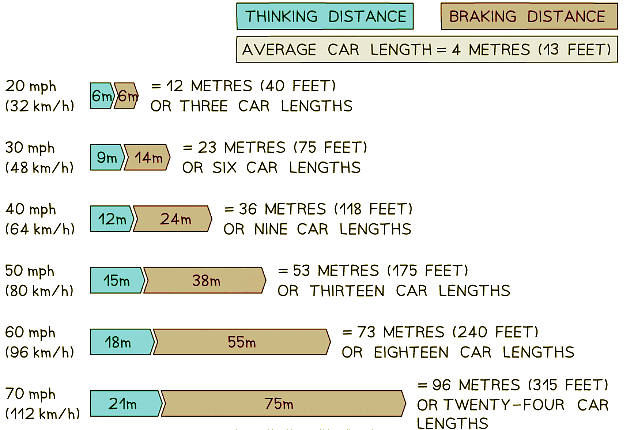
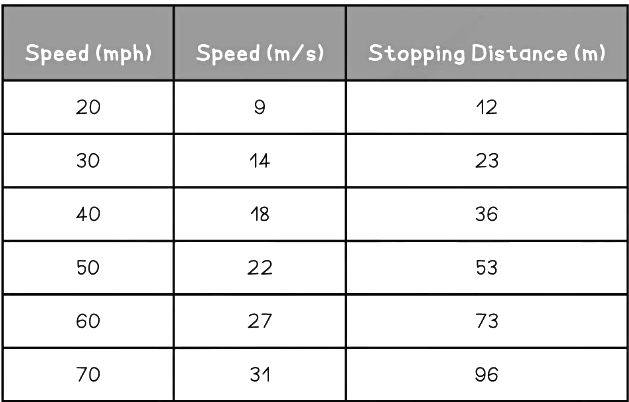
- The image below shows how the stopping distance of a typical family car increases with increasing speed:
 A vehicle's stopping distance increases with speed. At a speed of 20 mph the stopping distance is 12 m, whereas at 60 mph the stopping distance is 73 m (reproduced from the UK Highway Code)
Graphs Relating Speed to Stopping Distance
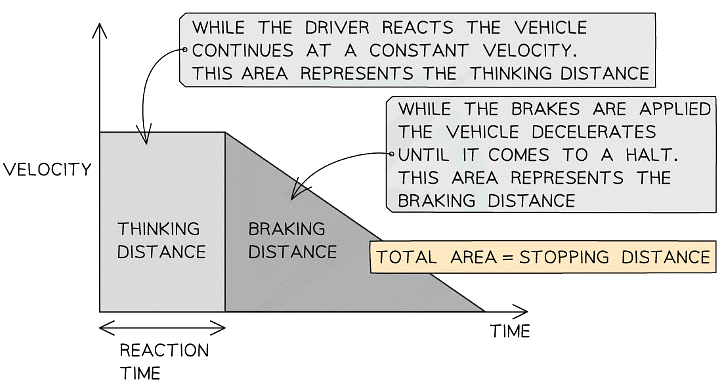
- The velocity-time graph below shows how the velocity of a car will typically change during an emergency stop
 Graph showing how the velocity typically changes as a vehicle comes to an emergency stop
 - While the driver reacts (the time taken to press the brakes is called the reaction time), the vehicle continues moving at a constant velocity
- The area underneath the graph during this time represents the thinking distance
- As soon as the brakes are applied, the vehicle decelerates to a halt
- The area underneath the graph during this time represents the braking distance
Solved Example
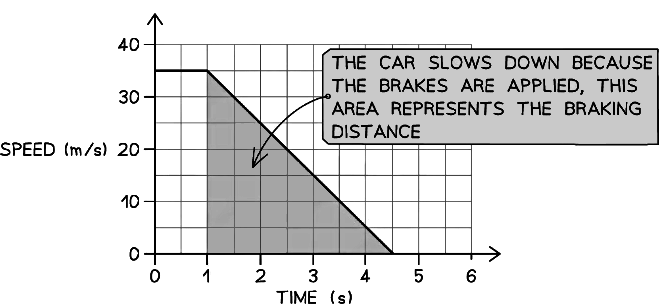
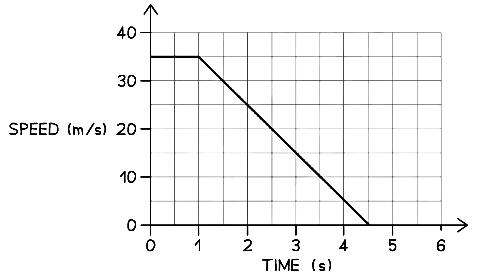
Example: While driving at a speed of 35 m/s, Stephen sees an obstacle in the road at time t = 0.The velocity-time graph below shows how the speed of the car changes as Stephen reacts and slams the brakes, bringing the car to a halt.
Determine
(a) The braking distance of the car.
(b) The driver's reaction time.
Part (a)
Step 1: Identify the section of the graph which represents the braking distance
(i) The area under a velocity-time graph represents distance travelled
(ii) The braking distance of the car is the distance travelled under the braking force
(iii) This area of the graph is shaded below:Step 2: Calculate the area under the graph during the car's deceleration
The area is a triangle, so the braking distance is given by:
Braking distance = Area = ½ × base × height
Braking distance = ½ × (4.5 – 1) × 35 = 61.3 mPart (b)
Step 1: Determine how long the driver takes before the brakes are applied
Between seeing the obstacle and applying the brakes, 1 second passes
This sequence of events is labelled on the graph below:The driver's reaction time is the time between the moment they see the obstacle to the moment the brakes are applied
Therefore, the driver's reaction time is 1 s
Measuring Reaction Time
- The reaction time is defined as:
A measure of how much time passes between seeing something and reacting to it - The human reaction time for someone who is alert - i.e. someone waiting to react to something happening, like an athlete waiting for the start of a race - is usually in the range of 0.2 - 0.9 seconds
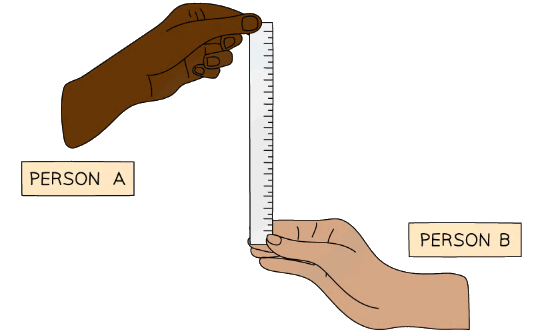
- A simple method for measuring human reaction time is illustrated below:

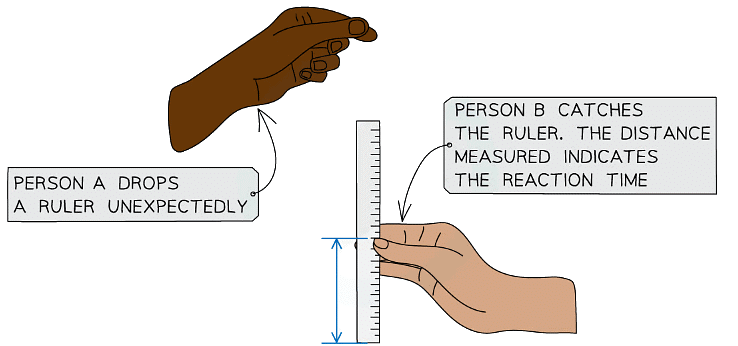
- Person A holds a 30 cm ruler vertically, such that the bottom end of the ruler hovers over the top of the hand of Person B
- Person A should release the ruler unexpectedly
- As soon as Person B sees the ruler move, they should close their hand, catching it
- The ruler is marked at the point at which it was caught by Person B - i.e. in line with the top of their hand
- This gives a measurement of the distance the ruler fell
- The greater the distance, the longer the reaction time
|
124 videos|149 docs|37 tests
|

|
Explore Courses for Grade 10 exam
|

|
