IELTS Exam > IELTS Notes > Writing for Academic IELTS > Vocabulary to describe Graphs
Vocabulary to describe Graphs | Writing for Academic IELTS PDF Download
Introducing the graph
The graph/table/pie chart/bar chart/diagram ...
- gives information about/on ...
- provides information about/on ...
- shows ...
- illustrates ...
- compares ...
- explains why ...
- describes ...
- draws the conclusion of (a survey) ...
Example: The pie charts provide information on the proportion of males and females working in agricultural sector.
Types of changes

Nouns

Verbs
- to rise
- to increase
- to surge
- to grow
- to peak
- Large rises:
- to rocket
- to soar
- to leap (->leapt)
- to fall
- to decrease
- to decline
- to dip
- to dive
- to plunge
- Large falls:
- to plummet
- to fluctuate
- to vary
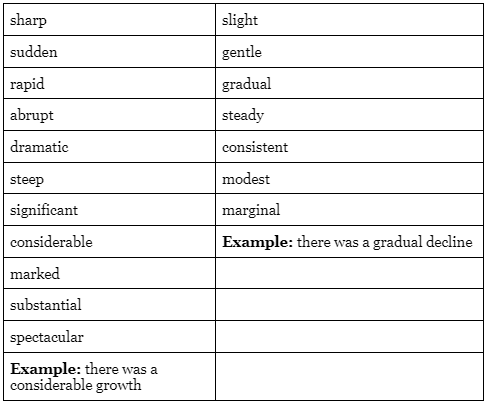
Description of changes

Adverbs

Adjectives

Useful phrases
- a small fraction, a small number, a small minority
- a large portion, a significant majority
- nearly a fifth, almost 10%, in region of 40%, more than a half, over a quarter, around two thirds, more or less three quarters, exactly one in ten, approximately a third
The document Vocabulary to describe Graphs | Writing for Academic IELTS is a part of the IELTS Course Writing for Academic IELTS.
All you need of IELTS at this link: IELTS
|
33 videos|200 docs|17 tests
|
FAQs on Vocabulary to describe Graphs - Writing for Academic IELTS
| 1. What are some common vocabulary words used to describe graphs in the IELTS exam? |  |
Ans. Some common vocabulary words used to describe graphs in the IELTS exam include "increase," "decrease," "fluctuate," "peak," "plateau," "trend," "data," "percentage," "proportion," "comparison," and "correlation."
| 2. How can I effectively describe the data shown in a graph during the IELTS exam? |  |
Ans. To effectively describe the data shown in a graph during the IELTS exam, you can start by giving an overview of the main trends or patterns. Then, you can focus on specific details such as the highest or lowest points, any significant changes or fluctuations, and any similarities or differences between the data sets.
| 3. What are some useful phrases to use when comparing data in a graph for the IELTS exam? |  |
Ans. Some useful phrases to use when comparing data in a graph for the IELTS exam include "In contrast," "On the other hand," "Similarly," "Likewise," "Compared to," "A noticeable difference," "A significant similarity," and "A clear distinction."
| 4. How can I effectively organize my response when describing a graph in the IELTS exam? |  |
Ans. To effectively organize your response when describing a graph in the IELTS exam, you can follow a structured approach. Start with an introduction where you mention the type of graph, the data source, and any significant trends. Then, move on to the main body where you provide a detailed analysis of the data, using appropriate vocabulary and comparing different aspects. Finally, conclude your response by summarizing the key findings and making any overall observations or predictions.
| 5. Are there any specific tips to follow when describing a line graph in the IELTS exam? |  |
Ans. When describing a line graph in the IELTS exam, it is important to focus on the overall trend, any changes or fluctuations, and any key points or milestones. You can also mention the highest and lowest points, the rate of increase or decrease, and any significant patterns or correlations. Additionally, using time-related vocabulary such as "over the period," "during the given time frame," or "from the beginning to the end" can help provide a clear and organized response.

|
Explore Courses for IELTS exam
|

|
Signup for Free!
Signup to see your scores go up within 7 days! Learn & Practice with 1000+ FREE Notes, Videos & Tests.
Related Searches


