Worksheet: Smart Charts - 1 | Mathematics for Class 4: NCERT PDF Download
Q: Answer the following Questions.
(i) Write the shaded part as a fraction.
(ii) From the chart, find the total number of children who like the food by them and answer the following.
(a) _______children like fruit.
(b) Children who like fruits are the total children.
(c) Eating Fruit is good. (True/False)
(d) Eating burgers and Pizza is bad. (True/False)
(iii) Find out with the help of the pie chart which of the following activity people are spending most of the time.

(iv) See the table below and answer:
(a) How many children like music programs?
(b) How many children like sports programs?
(c) Which program is like by a maximum number of children?
(d) Watching T.V. for longer hours is bad? (True/False)
(v) Go through the given graph and answer the following questions. How many children like cats more than that hamsters?
(vi) Look at the figure and answer: (a) Maximum temperature = _________.
(b) Minimum temperature = _________.
(c) Temperature in the month of March = _________.
(d) 30° C is the temperature in the month of = ___________.
(vii) The chart shows the result of a school in different years.
Fill in the blanks: (a) 75% result was in ________ year.
(b) In 2014 result was ________ %.
(c) Maximum result was in ________ year.
(d) Difference of maximum and minimum result ________.
(viii) Mia says that the number of people who travel by Bus and Bike is equal to the number of people who travel by car. Is she correct?

(ix) There are 400 students in a school. All the students take part in different clubs. See the pie chart and answer the following: (a) Maths club has _____ students.
(b) Science club has _____ students.
(c) Sports club has _____ students.
(d) Maths club students + Science club students = ______ students.
(x) From the chart below, answer the questions: (a) How many children are playing chess?
(b) How many children are playing Ludo?
(c) How many children are playing Carom Board?
(d) It is good to play indoor games during summer vacation. (True/False)
(xi) Use the graph to answer the following questions. How many votes did cheese get as a favorite snack?
(xii) See the chart below and answer: (a) How many triangles are there in the chart?
(b) Number of circles are ______.
(c) Number of squares are ________.
(d) Total no. of geometrical figures is ____________.
(xiii) Go through the given graph and answer the following questions: Which variety of apples has the maximum number of apples?
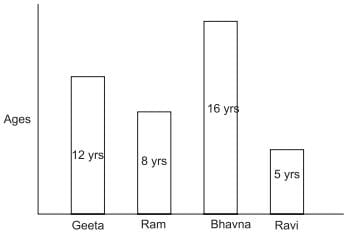
(xiv) Following chart shows the ages of some students.
Fill in the blanks. (a) Age of Ram is ________.
(b) ________ is the youngest.
(c) ________ is the eldest.
(d) Sum of Geeta and Ravi's age = ________.
(xv) Go through the given graph and answer the following questions: How many apples are red delicious?
(xvi) Write the un-shaded part as a fraction.
(xvii) Go through the given graph and answer the following questions: What is the difference between the number of taxi drivers in Goa and Bihar?
(xviii) Go through the given graph and answer the following questions. How many kids have hamsters as their favorite pets?
You can access the solutions to this worksheet here.
|
25 videos|123 docs|39 tests
|
FAQs on Worksheet: Smart Charts - 1 - Mathematics for Class 4: NCERT
| 1. What is a Smart Chart? |  |
| 2. How can Smart Charts be used in business? |  |
| 3. What are the advantages of using Smart Charts? |  |
| 4. Are there any limitations to using Smart Charts? |  |
| 5. What are some common types of Smart Charts? |  |

|
Explore Courses for Class 4 exam
|

|


