Class 5 Exam  >  Class 5 Notes  >  Mathematics for Class 5: NCERT  >  Worksheet: Smart Charts - 2

Smart Charts - 2 Class 5 Worksheet Maths Chapter 14

Answer the following Questions.

Q1: The following pie chart shows the favorite hobbies of the students of class V.
Smart Charts - 2 Class 5 Worksheet Maths Chapter 14(i) 
Which is the most favorite hobby?
(ii) Which two hobbies have equal popularity?
(iii) What part of the students like reading as a hobby?

Q2: Draw pictographs for the following data using a suitable symbol:
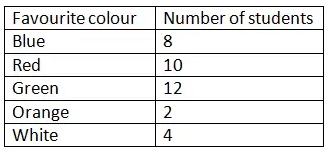
Smart Charts - 2 Class 5 Worksheet Maths Chapter 14

Q3: From the tally marks given below, answer the following questions:
Smart Charts - 2 Class 5 Worksheet Maths Chapter 14

(i) Write the total number of each vehicle in the table?
(ii) Auto rickshaws are thrice the number of trucks – true/false?
(iii) Write the number of cycles and auto rickshaw?

Q4: From the bar graph given below, answer the following:Smart Charts - 2 Class 5 Worksheet Maths Chapter 14
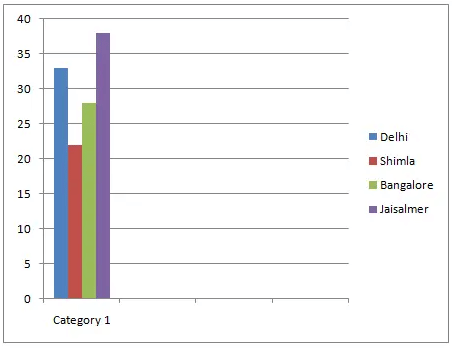
(i) Which city is the hottest?
(ii) 
Which city is the coldest?
(iii) Which two cities shows little change in temperature?

Q5: Anu bought 5 potatoes, 6 tomatoes, 2 cucumber, 7 coconuts and 4 onions. Represent the data by using tally marks.

Q6: The relation between dependent and independent variables is shown through a ________.

Q7: The number of goals second by a football term in different matches is given below:
3,1,0,4,6,0,0,1,1,2,2,3,5,1,2,0,1,0,2,3,9,2,0,1,0,1,4,1,0,2,5,1,2,
2,3,1,0,0,0,1,1,0,2,3,0,1,5,2,0
Make a frequency distribution table using tally makers.

Q8: The number of ATMs of different banks in a cityis shown below:
Draw a bar graph to represent the above information by choosing the scale of your choice.

Q9: In an examination, the grades achieved by 30 students of a class are given below. Arrange these grades in a table using tally marks:
B, C, C, E, A, C, B, B, D, D, D, D, B, C, C, C, A, C, B, E, A, D, C, B, E, C, B, E, C, D

Q10: The marks (out of 10) obtained by 28 students in a Mathematics test are listed as below :
8, 1, 2, 6, 5, 5, 5, 0, 1, 9, 7, 8, 0, 5, 8, 3, 0, 8, 10, 10, 3, 4, 8, 7, 8, 9, 2, 0
The number of students who obtained marks more than or equal to 5 is

You can access the solutions to this worksheet here.

The document Smart Charts - 2 Class 5 Worksheet Maths Chapter 14 is a part of the Class 5 Course Mathematics for Class 5: NCERT.
All you need of Class 5 at this link: Class 5
28 videos|169 docs|41 tests

Top Courses for Class 5

FAQs on Smart Charts - 2 Class 5 Worksheet Maths Chapter 14

1. What are smart charts?
Ans. Smart charts are visual representations of data that use technology and data analytics to provide real-time insights and interactive features. They are designed to help users understand complex information and make informed decisions.
2. How can smart charts benefit businesses?
Ans. Smart charts can benefit businesses in several ways. They provide a clear and concise way to present data, making it easier for decision-makers to understand trends and patterns. They also allow for real-time updates, enabling businesses to track and respond to changes quickly. Additionally, smart charts can help identify areas of improvement and optimize business processes.
3. Are smart charts difficult to create and use?
Ans. Smart charts can be created using various software and tools that offer user-friendly interfaces and pre-built templates. While there may be a learning curve in using these tools, they generally come with tutorials and support that make the process easier. Once created, smart charts are intuitive to use, with interactive features that allow users to drill down into specific data points for deeper analysis.
4. Can smart charts be used for personal financial planning?
Ans. Yes, smart charts can be useful for personal financial planning. They allow individuals to visualize their income, expenses, savings, and investments in a clear and organized manner. By using smart charts, individuals can track their financial goals, identify areas where they can save or invest more, and make informed decisions about their money.
5. What are some popular software tools for creating smart charts?
Ans. There are several popular software tools available for creating smart charts. Some widely used options include Microsoft Excel, Google Sheets, Tableau, and Power BI. These tools offer a range of features and functionalities, allowing users to create dynamic and visually appealing smart charts.
28 videos|169 docs|41 tests
Download as PDF
Explore Courses for Class 5 exam

Top Courses for Class 5

Signup for Free!
Signup to see your scores go up within 7 days! Learn & Practice with 1000+ FREE Notes, Videos & Tests.
10M+ students study on EduRev
Related Searches

Exam

,

pdf

,

past year papers

,

Objective type Questions

,

Summary

,

Smart Charts - 2 Class 5 Worksheet Maths Chapter 14

,

Smart Charts - 2 Class 5 Worksheet Maths Chapter 14

,

Smart Charts - 2 Class 5 Worksheet Maths Chapter 14

,

Semester Notes

,

MCQs

,

mock tests for examination

,

Previous Year Questions with Solutions

,

Free

,

study material

,

practice quizzes

,

ppt

,

video lectures

,

Sample Paper

,

shortcuts and tricks

,

Important questions

,

Extra Questions

,

Viva Questions

;