Class 4 Exam  >  Class 4 Notes  >  Mathematics for Class 4: NCERT  >  Worksheet Solutions: Smart Charts - 2

Worksheet Solutions: Smart Charts - 2 | Mathematics for Class 4: NCERT PDF Download

Q: Answer the following Questions.

(i) There are 400 students in a school. All the students take part in different club see the chapati chart and answer the following :
Worksheet Solutions: Smart Charts - 2 | Mathematics for Class 4: NCERT(a) Maths club has _____ students
(b) Science club has _____ students
(c) Sports club has _____ students
(d) Maths club students + Science club students = ______ students
Ans:

(a) 100
(b) 100
(c) 200
(d) 200

(ii) Write the shaded part as a fraction
Worksheet Solutions: Smart Charts - 2 | Mathematics for Class 4: NCERTAns: 
6/8

(iii) From the chart find the total numbers of children like the food by them and answer following:
Worksheet Solutions: Smart Charts - 2 | Mathematics for Class 4: NCERT

(a) ______ children like fruit
(b) Children who like fruits are 1/3 or 1/2 of the total children.  Worksheet Solutions: Smart Charts - 2 | Mathematics for Class 4: NCERT

(c) Eating Fruit is good. (True/False)
(d) Eating Burger and Pizza is bad. (True/False)
Ans:
(a) 30
(b) 1/3
(c) True
(d) True

(iv) Write the un-shaded part as a fraction.
Worksheet Solutions: Smart Charts - 2 | Mathematics for Class 4: NCERTAns: 
1/3

(v) From the chart below answer the questions:
Worksheet Solutions: Smart Charts - 2 | Mathematics for Class 4: NCERT(a) How many children are playing chess?Worksheet Solutions: Smart Charts - 2 | Mathematics for Class 4: NCERT

(b) How many children are playing Ludo?Worksheet Solutions: Smart Charts - 2 | Mathematics for Class 4: NCERT
(c) How many children are playing Carom Board.Worksheet Solutions: Smart Charts - 2 | Mathematics for Class 4: NCERT
(d) It is good to play indoor games during summer vacation. (True/False)
Ans:
(a) 3
(b) 4
(c) 2
(d) True

(vi) Find out with the help of the pie chart that in which of the following activity people are spending their most of the times?
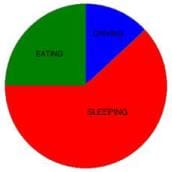
Worksheet Solutions: Smart Charts - 2 | Mathematics for Class 4: NCERTAns: 
Sleeping

The document Worksheet Solutions: Smart Charts - 2 | Mathematics for Class 4: NCERT is a part of the Class 4 Course Mathematics for Class 4: NCERT.
All you need of Class 4 at this link: Class 4
25 videos|123 docs|39 tests

Top Courses for Class 4

FAQs on Worksheet Solutions: Smart Charts - 2 - Mathematics for Class 4: NCERT

1. What is a smart chart and how does it work?
Ans. A smart chart is a visual representation of data that is interactive and dynamic. It allows users to easily analyze and manipulate data to gain insights and make informed decisions. Smart charts typically use advanced software and algorithms to organize and display data in a user-friendly format.
2. What are the advantages of using smart charts in data analysis?
Ans. Smart charts offer several advantages in data analysis. They allow for quick and easy data visualization, making it easier to identify patterns and trends. Smart charts also enable users to drill down into the data, allowing for deeper analysis and exploration. Additionally, they often have built-in features for data filtering, sorting, and calculations, further enhancing the analysis process.
3. Can smart charts be used for real-time data analysis?
Ans. Yes, smart charts can be used for real-time data analysis. Many smart chart tools and software have the capability to integrate with live data sources, allowing users to continuously monitor and analyze data as it is being updated. This is particularly useful in industries such as finance, sales, and manufacturing where real-time insights are crucial for decision-making.
4. Are smart charts user-friendly for non-technical users?
Ans. Yes, smart charts are designed to be user-friendly for non-technical users. They often have intuitive interfaces and drag-and-drop functionalities that make it easy for users to create and customize charts without requiring coding or programming skills. Many smart chart tools also provide tutorials and support to help users get started and become proficient in using the software.
5. Can smart charts be shared or exported for collaboration or presentation purposes?
Ans. Yes, smart charts can be shared or exported for collaboration or presentation purposes. Most smart chart tools allow users to save charts in various file formats such as PDF or image files, which can be easily shared via email or shared on collaborative platforms. Some tools also offer cloud-based sharing options, allowing multiple users to access and interact with the same chart simultaneously.
25 videos|123 docs|39 tests
Download as PDF
Explore Courses for Class 4 exam

Top Courses for Class 4

Signup for Free!
Signup to see your scores go up within 7 days! Learn & Practice with 1000+ FREE Notes, Videos & Tests.
10M+ students study on EduRev
Related Searches

Sample Paper

,

MCQs

,

Worksheet Solutions: Smart Charts - 2 | Mathematics for Class 4: NCERT

,

Previous Year Questions with Solutions

,

Semester Notes

,

Exam

,

Worksheet Solutions: Smart Charts - 2 | Mathematics for Class 4: NCERT

,

practice quizzes

,

video lectures

,

Free

,

Viva Questions

,

shortcuts and tricks

,

Extra Questions

,

Summary

,

past year papers

,

Objective type Questions

,

Worksheet Solutions: Smart Charts - 2 | Mathematics for Class 4: NCERT

,

mock tests for examination

,

Important questions

,

study material

,

pdf

,

ppt

;