Practice Questions: Statistics

Question 1. Following are the marks obtained by 40 students of class IX in an examination:
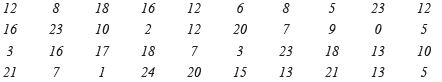
(i) Present the data in the form of frequency distribution using the same class size such as 0-5, 5-10, etc.
(ii) How many students obtained marks below 15?
Solution: The lowest value of the observations = 1.
The highest value of the observations = 24.
Choose class width = 5 so that classes are of the form 0-5, 5-10, etc.
∴ To cover all the given data, the required class-intervals are: 0-5, 5-10, 10-15, 15-20, 20-25.
(i) The frequency distribution corresponding to these classes is given below:
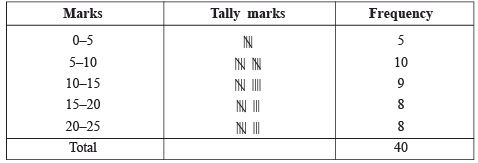
(ii) Number of students who obtained marks below 15 equals the sum of frequencies of the classes 0-5, 5-10 and 10-15.
= 5 + 10 + 9 = 24.
∴ Number of students who obtained marks below 15 = 24.
Question 2. The house-tax bills (in rupees) of 30 houses in a locality are given below:
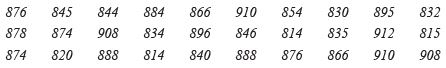
Construct a frequency distribution table with class size 10.
Solution: The lowest observation = 814.
The highest observation = 912.
Class size = 10.
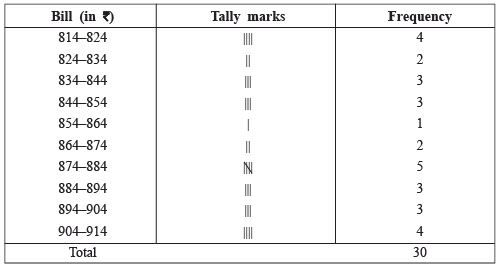
Using class width 10, the class-intervals chosen to cover the data are: 814-824, 824-834, 834-844, 844-854, 854-864, 864-874, 874-884, 884-894, 894-904, 904-914.
Thus, the required frequency distribution table for these classes is given below:
Note: A frequency distribution in which each upper limit of each class is excluded and the lower limit is included, is called an exclusive form or the continuous form whereas on the other hand a frequency distribution in which each upper limit as well as lower limit is included, is called an inclusive form.
Question 3. Following data gives the marks (out of 50), obtained by 30 students of a class in a test:
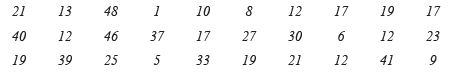
Arrange the data using classes as 0-10, 11-20, etc.
Solution: The lowest observation = 1.
The highest observation = 48.
Using the given class pattern, the required class-intervals are: 0-10, 11-20, 21-30, 31-40, 41-50.
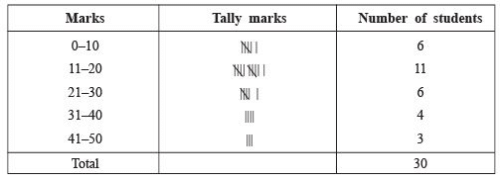
The grouped frequency table arranged with these classes is as follows:
Question 4. If the mean of the following data is 18.75, then find the value of p.
| xi | 10 | 15 | p | 25 | 30 |
| fi | 5 | 10 | 7 | 8 | 2 |
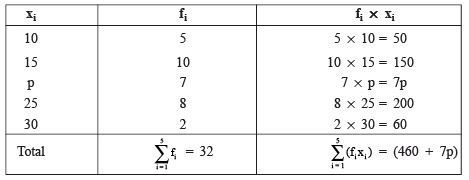
Solution: Writing the given data in the form of xi and fi, we compute the total frequency and the sum of xi·fi.
Total frequency, N = 5 + 10 + 7 + 8 + 2 = 32.
Sum of xi·fi = (10 × 5) + (15 × 10) + (p × 7) + (25 × 8) + (30 × 2).
= 50 + 150 + 7p + 200 + 60 = 460 + 7p.
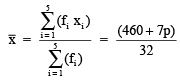
But mean x̄ = (Sum of xi·fi) / N = 18.75.
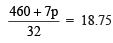
Therefore, (460 + 7p) / 32 = 18.75.
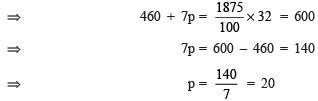
⇒ 460 + 7p = 18.75 × 32.
Now 18.75 × 32 = 600.
⇒ 460 + 7p = 600.
⇒ 7p = 600 - 460 = 140.
⇒ p = 140 / 7 = 20.
Thus, the required value of p is 20.
∴ 
But the mean of the given data is 18.75.
∴
Question 5. If the marks of 41 students of a class are given in the following table, then find the median of marks obtained.
| Marks obtained | Frequency |
| 30 25 27 40 32 35 | 10 2 5 4 12 8 |
Solution: Arranging the observations in ascending order, we have:
| Marks obtained | 25 | 27 | 30 | 32 | 35 | 40 |
| Frequency | 2 | 5 | 10 | 12 | 8 | 4 |
Now, we prepare the cumulative frequency table as given below:
| Marks obtained | Frequency | Cumulative frequency |
| 25 27 30 32 35 40 | 2 5 10 12 8 4 | 2 7 17 29 37 41 |
∵ Total number of observations = 41 (an odd number).
∴ Median position =  student
(n + 1) / 2 = (41 + 1) / 2 = 21.∴ Median of marks = marks obtained by the 21st student.
From the cumulative frequency table, cumulative frequency reaches 17 at mark 30 and 29 at mark 32.
Hence, the 18th to 29th observations correspond to mark 32; therefore the 21st student has mark 32.
∴ The median of the marks = 32.
Question 6. Prove that  (xi - x̄)= 0, where x̄ is the mean of the 'n' observations x1, x2, x3, x4,..., xn.
Solution: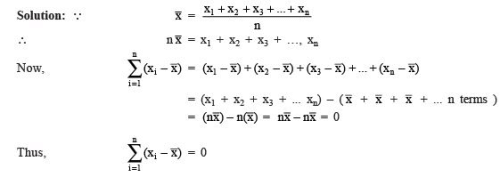
By definition, x̄ = (1 / n) ∑i=1n xi.
Consider the sum S = ∑i=1n (xi - x̄).
S = ∑i=1n xi - ∑i=1n x̄.
Since x̄ is constant for all terms, ∑i=1n x̄ = n·x̄.
Therefore, S = ∑i=1n xi - n·x̄.
But x̄ = (1 / n) ∑i=1n xi, hence n·x̄ = ∑i=1n xi.
Thus S = ∑i=1n xi - ∑i=1n xi = 0.
Hence proved that ∑i=1n (xi - x̄) = 0.
FAQs on Practice Questions: Statistics
| 1. What is statistics? |  |
| 2. What are the different types of data in statistics? | |
| 3. What is the purpose of statistical analysis? | |
| 4. What are measures of central tendency in statistics? | |
| 5. How is probability used in statistics? | |


