Class 8 Maths Chapter 13 Important Question Answers - Introduction to Graphs

Q1: A train is moving at a constant speed of 60kmh−1. Draw a distance - time graph
(a) How far will it travel in 22 hours 3030 minutes
(b) Find the time required to cover a distance of 260km.
Sol: Speed of train = 60km/hr
Table for distance - time graph is as follows:

Scale:
On x− axis 1cm=1hr
On y− axis 1cm = 60km
(a) Distance covered in 22 hours 3030 minutes = 150km
(b) Time required to cover a distance of 260km = 4.332

Q2: Study the following graph and answer the following questions

Sol:
(a) Which year has better rainfall?
Ans: 2007
(b) On how many days the rainfall was same?
Ans: For 8th July and 9th July of 2007 the rainfall was same.
(c) Name the only date on which 20082008 got more rainfall?
Ans: On 6n July of 2008 rainfall is max (7cm)
(d) On which date the difference between the rainfall of the 2 years was biggest?
Ans: 8hy July
(e) What is the difference between the rainfall of 2007 and 2008 on July 8th?
Ans: 3cm of difference
On July 8th in 2007=2007= Rainfall =5cm
On July 8th in 2008=2008= Rainfall =2cm
Difference = 5 − 2 = 3cm
Q3: Reena deposited Rs12,000in a bank at the rate of 10% per annum. Draw a linear graph showing the relationship between the time and simple interest. Also find the simple interest for 4 years.
Sol: P = 12,000
R = 10%
Simple interest for one year = PTR / 100
= 12000 x 10/100 x 1
= 1200

Simple interest after 4 years is 4800.
Q4: Hundred students from a certain locality use different modes of travelling to school as given below. Draw a bar graph which is maximum mode of travel?

Sol: Scale: on x− axis 1cm = 1 unit
On y− axis 1cm=8 units

Maximum mode of travel is bus.
Q5: Draw the histogram to represent the following data and define linear graph.
Sol:
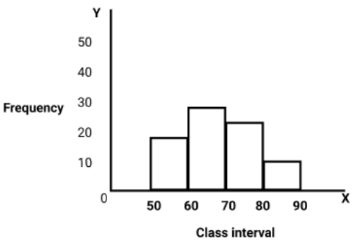
A line graph which is a whole unbroken line is called a linear graph.
Q6: State true or false
(a) A point whose x−co-ordinates is zero and y− co-ordinates is non-zero will lie on the y−axis
(b) The co-ordinates of the origin are (0,0)
(c) A point whose y−co-ordinates is zero and x− co-ordinates is 4 will lie on the y−axis
Ans:
(a) True
(b) True
(c) False
Q7: Plot the points A(4,0) and B(0,3) on the graph. Also find the length of hypotenuse of triangle AOB
Sol: OA = x− co-ordinate of point A = 4
OB = y−co-ordinate of point B = 3

AB = √16 + 9
AB = √25
AB = 5.
Q8: Draw a line passing through (3,1) and (1,3). Find the co-ordinates of the points at which this line meets the x− axis and y− axis.
Sol: The co-ordinates of the point on x− axis and y− axis is where the line meets axes.

x− axis, P = (4, 0)
y− axis, Q = (0, 4)
Q9: Find the time taken by a body to cover 30 meters. Hence find speed?

Sol: Time taken to cover a distance of 30m = 6 seconds
Speed = Distance covered / Time taken
Speed = 30m/6s
= 5ms-1
Q10: If a man moves 6 units right due (east) from point A, then find the co-ordinates of his new position.

Sol: The position of point A = (3, 0)
If a man moves 6 units right from point A then new position of man will be at B = (6, 3).
Q11: What is a pie graph?
Ans: Data can be represented by dividing a circle into sectors. This type of representation of data is called a pic graph. It shows us the relation of parts to the whole.
Q12: Perpendicular distance of the point (2, 3) from x− axis is
(a) 2
(b) 3
(c) 0
(d) None of these
Ans: (b)
Q13: The point where x− axis and y− axis meet is called __________?
Ans: Origin
Q14: Find the co-ordinates of the points A, B, C, D from the graph.

Sol: The co-ordinates of the point
A = (−1, 3)
B = (3, 3)
C = (−2, 3)
D = (−1, −2)
Q15: In a class of 40 students, the marks obtained in maths subject (out of 50) are as given below.

Draw histogram?
Sol:

|
79 videos|408 docs|31 tests
|
FAQs on Class 8 Maths Chapter 13 Important Question Answers - Introduction to Graphs
| 1. What is a graph in computer science? |  |
| 2. What are the types of graphs commonly used in computer science? | |
| 3. What is the difference between a graph and a tree? | |
| 4. How are graphs represented in computer memory? | |
| 5. What are some common applications of graphs in computer science? | |


mock tests for examination
,Summary
,Class 8 Maths Chapter 13 Important Question Answers - Introduction to Graphs
,ppt
,Extra Questions
,practice quizzes
,Objective type Questions
,shortcuts and tricks
,Class 8 Maths Chapter 13 Important Question Answers - Introduction to Graphs
,Important questions
,Free
,Sample Paper
,Semester Notes
,Viva Questions
,Class 8 Maths Chapter 13 Important Question Answers - Introduction to Graphs
,Previous Year Questions with Solutions
,past year papers
,MCQs
,study material
,video lectures
,Exam
;


Important Questions: Introduction to Graphs Free PDF Download
Importance of Important Questions: Introduction to Graphs
Important Questions: Introduction to Graphs Notes
Important Questions: Introduction to Graphs Class 8
Study Important Questions: Introduction to Graphs on the App
|
© EduRev
|
Education Revolution
|


|


