NCERT Exemplar Solutions: Data Handling | Mathematics (Maths) Class 8 PDF Download
Exercise Page: 42
In questions 1 to 35 there are four options given, out of which one is correct. Choose the correct answer.
Q.1. The height of a rectangle in a histogram shows the
(a) Width of the class
(b) Upper limit of the class
(c) Lower limit of the class
(d) Frequency of the class
Ans: (d)
Q.2. A geometric representation showing the relationship between a whole and its parts is a
(a) Pie chart
(b) Histogram
(c) Bar graph
(d) Pictograph
Ans: (a)
Explanation: A geometric representation showing the relationship between a whole and its parts is pie chart.
Q.3. In a pie chart, the total angle at the centre of the circle is
(a) 180o
(b) 360o
(c) 270o
(d) 90o
Ans: (b)
Q.4. The range of the data 30, 61, 55, 56, 60, 20, 26, 46, 28, 56 is
(a) 26
(b) 30
(c) 41
(d) 61
Ans: (c)
Explanation: The difference between the lowest and the highest observation in a given data is called its Range.
Then, Range = Highest observation – Lowest observation
= 61 – 20
= 41
Q.5. Which of the following is not a random experiment?
(a) Tossing a coin
(b) Rolling a dice
(c) Choosing a card from a deck of 52 cards
(d) Throwing a stone from a roof of a building
Ans: (d)
Explanation: There is only one output that is the stone will fall down therefore it is not a random experiment.
Q.6. What is the probability of choosing a vowel from the alphabets?
(a) 21/26
(b) 5/26
(c) 1/26
(d) 3/26
Ans: (b)
Explanation: Probability = Number of Vowels/ Total number of alphabets
= 5/26
Q.7. In a school only, 3 out of 5 students can participate in a competition. What is the probability of the students who do not make it to the competition?
(a) 0.65
(b) 0.4
(c) 0.45
(d) 0.6
Ans: (b)
Explanation: Probability = Number of students who do not make it to the competition / Total number of students.
= 2/5
= 0.4
Students of a class voted for their favorite colour and a pie chart was prepared based on the data collected.
Observe the pie chart given below and answer questions 8 –10 based on it.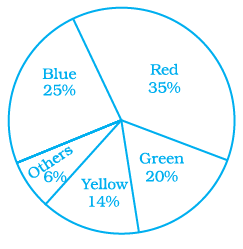
Q.8. Which colour received 1/5 of the votes?
(a) Red
(b) Blue
(c) Green
(d) Yellow
Ans: (c)
Explanation: = 1/5 × 100
= 0.2 × 100
= 20%
Q.9. If 400 students voted in all, then how many did vote ‘Others’ colour as their favorite?
(a) 6 (b) 20 (c) 24 (d) 40
Ans: (c)
Explanation: From the pie chart, 6% out of 400 students voted for others,
So,
= (6%/100%) × 400
= 0.06 × 400
= 24
Q.10. Which of the following is a reasonable conclusion for the given data?
(a) (1/20)th student voted for blue colour
(b) Green is the least popular colour
(c) The number of students who voted for red colour is two times the number of students who voted for yellow colour
(d) Number of students liking together yellow and green colour is approximately the same as those for red colour.
Ans: (d)
Q.11. Listed below are the temperature in oC for 10 days.
–6, –8, 0, 3, 2, 0, 1, 5, 4, 4
What is the range of the data?
(a) 8
(b) 13oC
(c) 10oC
(d) 12oC
Ans: (b)
Explanation: The difference between the lowest and the highest observation in a given data is called its Range.
Then, Range = Highest observation – Lowest observation
= 5 – (-8)
= 5 + 8
= 13oC
Q.12. Ram put some buttons on the table. There were 4 blue, 7 red, 3 black and 6 white buttons in all. All of a sudden, a cat jumped on the table and knocked out one button on the floor. What is the probability that the button on the floor is blue?
(a) 7/20
(b) 3/5
(c) 1/5
(d) 1/4
Ans: (c)
Explanation: Probability = Number of blue buttons on the table / Total number of buttons on the table
= 4/20 … [divide both numerator and denominator by 4]
= 1/5
Q.13. Rahul, Varun and Yash are playing a game of spinning a coloured wheel. Rahul wins if spinner lands on red. Varun wins if spinner lands on blue and Yash wins if it lands on green. Which of the following spinner should be used to make the game fair?
(a) (i)
(b) (ii)
(c) iii
(d) (iv)
Ans: (d)
Explanation: (d) (iv) this figure contains equal share for three colours.
Q.14. In a frequency distribution with classes 0 –10, 10 –20 etc., the size of the class intervals is 10. The lower limit of fourth class is
(a) 40
(b) 50
(c) 20
(d) 30
Ans: (d)
Explanation: The lower value of the class interval is called its Lower Class Limit.
First class = 0 -10
Second class = 10 – 20
Third class = 20 – 30
Fourth class = 30 – 40
Fifth class = 40 – 50
and Tenth class = 90 – 100
Q.15. A coin is tossed 200 times and head appeared 120 times. The probability of getting a head in this experiment is
(a) 2/5
(b) 3/5
(c) 1/5
(d) 4/5
Ans: (b)
Explanation: Probability = Number of times head appeared / Total number of times coin is tossed
= 120/200
= 12/20 … [divide both numerator and denominator by 4]
= 3/5
Q.16. Data collected in a survey shows that 40% of the buyers are interested in buying a particular brand of toothpaste. The central angle of the sector of the pie chart representing this information is
(a) 120o
(b) 150o
(c) 144o
(d) 40o
Ans: (c)
Explanation: = (40/100) × 360o
= 0.4 × 360o
= 144o
Q.17. Monthly salary of a person is Rs. 15000. The central angle of the sector representing his expenses on food and house rent on a pie chart is 60°. The amount he spends on food and house rent is
(a) Rs. 5000
(b) Rs. 2500
(c) Rs. 6000
(d) Rs. 9000
Ans: (b)
Explanation: From the question,
The part of monthly salary spent on food and house rent = 60o/360o
The amount he spends on food and house rent is = (60o/360o) × 15000
= Rs. 2500
Q.18. The following pie chart gives the distribution of constituents in the human body. The central angle of the sector showing the distribution of protein and other constituents is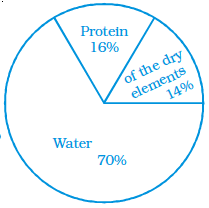
(a) 108o
(b) 54o
(c) 30o
(d) 216o
Ans: (a)
Explanation: The following pie chart gives the distribution of constituents
in the human body = 16% + 14% = 30%
= (30/100) × 360o
= 108o
Q.19. Rohan and Shalu are playing with 5 cards as shown in the figure. What is the probability of Rohan picking a card without seeing, that has the number 2 on it?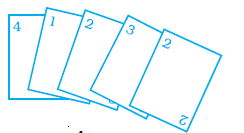
(a) 2/5
(b) 1/5
(c) 3/5
(d) 4/5
Ans: (a)
Explanation: Probability = Number of cards having 2/ Total number of cards
= 2/5
Q.20. The following pie chart represents the distribution of proteins in parts of a human body. What is the ratio of distribution of proteins in the muscles to that of proteins in the bones?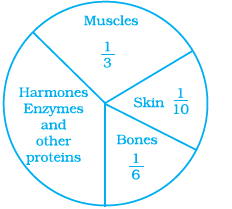
(a) 3 : 1
(b) 1 : 2
(c) 1 : 3
(d) 2 : 1
Ans: (d)
Explanation: From the chart,
Distribution of protein in the muscles = 1/3
Distribution of protein in the bones = 1/6
Then,
Ratio of distribution of proteins in the muscles to that of proteins in the bones,
= 1/3 : 1/6
= (1/3) × (6/1)
= (1/1) × (2/1)
= 2/1
= 2 : 1
Q.21. What is the central angle of the sector (in the above pie chart) representing skin and bones together?
(a) 36o
(b) 60o
(c) 90o
(d) 96o
Ans: (d)
Explanation: Distribution of protein in the skin = 1/10
Distribution of protein in the bones = 1/6
Central angle of the sector representing skin and bones,
= 1/10 + 1/6
= (3 + 5)/30
= 8/30 × 360o
= 96o
Q.22. What is the central angle of the sector (in the above pie chart) representing hormones enzymes and other proteins.
(a) 120o
(b) 144o
(c) 156o
(d) 176o
Ans: (b)
Explanation: Distribution of protein in the skin = 1/10
Distribution of protein in the bones = 1/6
Distribution of protein in the Muscles = 1/3
Central angle of the sector representing skin, muscles and bones,
= 1/10 + 1/6 + 1/3
= (3 + 5 + 10)/30
= 18/30 × 360o
= 216o
Then,
Central angle of the sector representing hormones enzymes and other proteins,
= 360o – 216o
= 144o
Q.23. A coin is tossed 12 times and the outcomes are observed as shown below:
The chance of occurrence of Head is
(a) 1/2
(b) 5/12
(c) 7/12
(d) 5/7
Ans: (b)
Q.24. Total number of outcomes, when a ball is drawn from a bag which contains 3 red, 5 black and 4 blue balls is
(a) 8
(b) 7
(c) 9
(d) 12
Ans: (d)
Q.25. A graph showing two sets of data simultaneously is known as
(a) Pictograph
(b) Histogram
(c) Pie chart
(d) Double bar graph
Ans: (d)
Q.26. Size of the class 150 –175 is
(a) 150
(b) 175
(c) 25
(d) –25
Ans: (c)
Explanation: The difference between the upper class limit and lower class limit of a class is called the Size of the class.
= Upper limit – lower limit
= 175 – 150
= 25
Q.27. In a throw of a dice, the probability of getting the number 7 is
(a) 1/2
(b) 1/6
(c) 1
(d) 0
Ans: (d)
Explanation: Only 1, 2, 3, 4, 5 and 6 are in the dice. So, no chance of getting number 7.
Q.28. Data represented using circles is known as
(a) Bar graph
(b) Histogram
(c) Pictograph
(d) Pie chart
Ans: (d)
Q.29. Tally marks are used to find
(a) Class intervals
(b) Range
(c) Frequency
(d) Upper limit
Ans: (c)
Q.30. Upper limit of class interval 75 –85 is
(a) 10
(b) –10
(c) 75
(d) 85
Ans: (d)
Q.31. Numbers 1 to 5 are written on separate slips, i.e. one number on one slip and put in a box. Wahida pick a slip from the box without looking at it. What is the probability that the slip bears an odd number?
(a) 1/5
(b) 2/5
(c) 3/5
(d) 4/5
Ans: (c)
Explanation: Number 1 to 5 = 1, 2, 3, 4, 5
Odd number 1 to 5 = 1, 3, 5
Probability = total number of odd number slips/ Total number of slips
= 3/5
Q.32. A glass jar contains 6 red, 5 green, 4 blue and 5 yellow marbles of same size. Hari takes out a marble from the jar at random. What is the probability that the chosen marble is of red colour?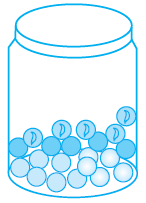
(a) 7/10
(b) 3/10
(c) 4/5
(d) 2/5
Ans: (b)
Explanation: Probability = total number of red marbles/ Total number of marbles
= 6/20 … [divide numerator and denominator by 2]
= 3/10
Q.33. A coin is tossed two times. The number of possible outcomes is
(a) 1
(b) 2
(c) 3
(d) 4
Ans: (d) 4
Explanation: Head Head, Tail Tail, Tail Head, Head Tail.
Q.34. A coin is tossed three times. The number of possible outcomes is
(a) 3
(b) 4
(c) 6
(d) 8
Ans: (d) 8
Explanation: HHH, TTT, THH, HTH, HHT, HTT, THT, TTH
Q.35. A dice is tossed two times. The number of possible outcomes is
(a) 12 (b) 24 (c) 36 (d) 30
Ans: (c)
Explanation: (1, 1), (1, 2), (1, 3), (1, 4), (1, 5), (1, 6) = 6
(2, 1), (2, 2), (2, 3), (2, 4), (2, 5), (2, 6) = 6
(3, 1), (3, 2), (3, 3), (3, 4), (3, 5), (3, 6) = 6
(4, 1), (4, 2), (4, 3), (4, 4), (4, 5), (4, 6) = 6
(5, 1), (5, 2), (5, 3), (5, 4), (5, 5), (5, 6) = 6
(6, 1), (6, 2), (6, 3), (6, 4), (6, 5), (6, 6) = 6
= 36
In questions 36 to 58, fill in the blanks to make the statements true.
Q.36. Data available in an unorganised form is called data.
Solution: Data available in an unorganised form is called raw data.
Q.37. In the class interval 20 – 30, the lower class limit is.
Solution: In the class interval 20 – 30, the lower class limit is 20.
Q.38. In the class interval 26 – 33, 33 is known as.
Solution: In the class interval 26 – 33, 33 is known as upper class limit.
Q.39. The range of the data 6, 8, 16, 22, 8, 20, 7, 25 is.
Solution: The difference between the lowest and the highest observation in a given data is called its Range.
Then, Range = Highest observation – Lowest observation
= 25 – 6
= 19
The range of the data 6, 8, 16, 22, 8, 20, 7, 25 is 19.
Q.40. A pie chart is used to compare to a whole.
Solution: A pie chart is used to compare parts to a whole.
Q.41. In the experiment of tossing a coin one time, the outcome is either or.
Solution: In the experiment of tossing a coin one time, the outcome is either Head or Tail.
Q.42. When a dice is rolled, the six possible outcomes are.
Solution: When a dice is rolled, the six possible outcomes are 1, 2, 3, 4, 5 and 6.
Q.43. Each outcome or a collection of outcomes in an experiment makes an .
Solution: Each outcome or a collection of outcomes in an experiment makes an Event.
Q.44. An experiment whose outcomes cannot be predicted exactly in advance is called a experiment.
Solution: An experiment whose outcomes cannot be predicted exactly in advance is called a random experiment.
Q.45. The difference between the upper and lower limit of a class interval is called the of the class interval.
Solution: The difference between the upper and lower limit of a class interval is called the Size/width of the class interval.
Q.46. The sixth class interval for a grouped data whose first two class intervals are 10 – 15 and 15 – 20 is.
Solution: The sixth class interval for a grouped data whose first two class intervals are 10 – 15 and 15 – 20 is 35 – 40.
Histogram given on the right shows the number of people owning the different number of books.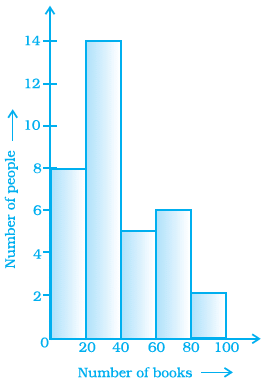
Answer 47 to 50 based on it
Q.47. The total number of people surveyed is.
Solution: Form the Histogram,
The total number of people surveyed is 35.
Q.48. The number of people owning books more than 60 is.
Solution: The number of people owning books more than
60 is 8.
Q.49. The number of people owning books less than 40 is.
Solution: The number of people owning books less than 40 is 22.
Q.50. The number of people having books more than 20 and less than 40 is.
Solution: The number of people having books more than 20 and less than 40 is 14.
Q.51. The number of times a particular observation occurs in a given data is called its.
Solution: The number of times a particular observation occurs in a given data is called its Frequency.
Q.52. When the number of observations is large, the observations are usually organised in groups of equal width called.
Solution: When the number of observations is large, the observations are usually organised in groups of equal width called class intervals.
Q.53. The total number of outcomes when a coin is tossed is.
Solution: The total number of outcomes when a coin is tossed is 2.
Q.54. The class size of the interval 80 – 85 is.
Solution: = 85 – 80
= 5
The class size of the interval 80 – 85 is 5.
Q.55. In a histogram __________ are drawn with width equal to a class interval without leaving any gap in between.
Solution: In a histogram bars are drawn with width equal to a class interval without leaving any gap in between.
Q.56. When a dice is thrown, outcomes 1, 2, 3, 4, 5, 6 are equally.
Solution: When a dice is thrown, outcomes 1, 2, 3, 4, 5, 6 are equally likely.
Q.57. In a histogram, class intervals and frequencies are taken along __________ axis and __________ axis.
Solution: In a histogram, class intervals and frequencies are taken along X axis and Y axis.
Q.58. In the class intervals 10 –20, 20 –30, etc., respectively, 20 lies in the class.
Solution: In the class intervals 10 –20, 20 –30, etc., respectively, 20 lies in the class 20 – 30.
In questions 59 to 81, state whether the statements are true (T) or false (F).
Q.59. In a pie chart a whole circle is divided into sectors.
Solution: True.
Pie chart shows the relationship between a whole and its parts.
Q.60. The central angle of a sector in a pie chart cannot be more than 180o.
Solution: False.
The central angle of a sector in a pie chart is more than 180o. But, cannot be more than 360o.
Q.61. Sum of all the central angles in a pie chart is 360°.
Solution: True.
Q.62. In a pie chart two central angles can be of 180o.
Solution: True.
We know that sum of all the central angles in a pie chart is 360o. So, if two angles have 180o each then the sum of two angles is 360o.
Q.63. In a pie chart two or more central angles can be equal.
Solution: True.
Yes, in a pie chart two or more central angles can be equal.
Q.64. Getting a prime number on throwing a die is an event.
Solution: True.
Each outcome or a collection of outcomes in an experiment makes an Event.
Using the following frequency table, answer question 65-68
Q.65. 9 students got full marks.
Solution: True.
From the table, given that 9 students got 10 out of 10 marks.
Q.66. The frequency of less than 8 marks is 29.
Solution: False.
The frequency of less than 8 marks is 8 + 10 + 5 = 23 students.
Q.67. The frequency of more than 8 marks is 21.
Solution: True.
The frequency of more than 8 marks is 12 + 9 = 21 students.
Q.68. 10 marks the highest frequency.
Solution: False.
9 marks has highest frequency, i.e. 12. But, 10 has 9 frequency.
Q.69. If the fifth class interval is 60 – 65, fourth class interval is 55 – 60, then the first class interval is 45 –50.
Solution: False.
The first class interval is 40 – 45, second class interval is 45 – 50, third class interval is
50 – 55, fourth class interval 55 – 60, fifth class interval is 60 – 65.
Q.70. From the histogram given on the right, we can say that 1500 males above the age of 20 are literate.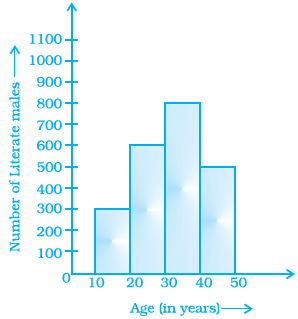
Solution: False.
From the histogram given on the right, we
can say that 1900 (600 + 800 + 500) males above the age of 20 are
literate.
Q.71. The class size of the class interval 60 – 68 is 8.
Solution: True.
The difference between the upper and lower limit of a class interval is called the
Size of the class interval. i.e. 68 – 60 = 8
Q.72. If a pair of coins is tossed, then the number of outcomes are 2.
Solution: False.
If a pair of coins is tossed, then the number of outcomes are 4, i.e. HH, TT, TH and HT.
Q.73. On throwing a dice once, the probability of occurence of an even number is ½.
Solution: True.
The even numbers in a dice are 2, 4 and 6.
Probability = total number of even numbers/ Total numbers
= 3/6 … [divide numerator and denominator by 3]
= ½
Q.74. On throwing a dice once, the probability of occurence of a composite number is ½.
Solution: False.
The composite numbers in a dice are 4 and 6.
Probability = total number of composite numbers/ Total numbers
= 2/6 … [divide numerator and denominator by 2]
= 1/3
Q.75. From the given pie chart, we can infer that production of Manganese is least in state B.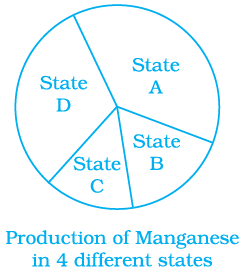
Solution: False.
It is not possible to declare, from the given pie chart that the production of Manganese is least in state B. Because, we do not know the central angle of the sectors.
Q.76. One or more outcomes of an experiment make an event.
Solution: True.
Each outcome or a collection of outcomes in an experiment makes an Event.
Q.77. The probability of getting number 6 in a throw of a dice is 1/6. Similarly the probability of getting a number 5 is 1/5.
Solution: False.
The probability of getting a number 5 is 1/6.
Q.78. The probability of getting a prime number is the same as that of a composite number in a throw of a dice.
Solution: False.
The composite numbers in a dice are 4 and 6.
Probability = total number of composite numbers/ Total numbers
= 2/6 … [divide numerator and denominator by 2]
= 1/3
The prime numbers in a dice are 2, 3 and 5.
Probability = total number of prime numbers/ Total numbers
= 3/6 … [divide numerator and denominator by 3]
= ½
Q.79. In a throw of a dice, the probability of getting an even number is the same as that of getting an odd number.
Solution: True.
The even numbers in a dice are 2, 4 and 6.
Probability = total number of even numbers/ Total numbers
= 3/6 … [divide numerator and denominator by 3]
= ½
The odd numbers in a dice are 1, 3 and 5.
Probability = total number of odd numbers/ Total numbers
= 3/6 … [divide numerator and denominator by 3]
= ½
Q.80. To verify Pythagoras theorem is a random experiment.
Solution: False.
We know the result i.e. only one result before going to verify the Pythagoras theorem. So, it is not a random experiment.
Q.81. The following pictorial representation of data is a histogram.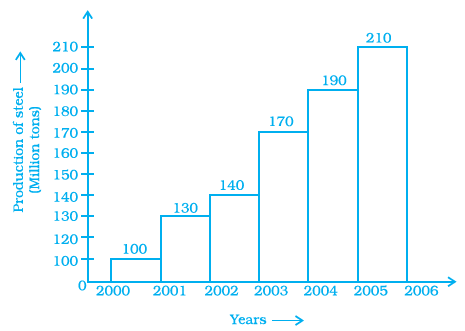
Solution: True.
Histogram is a type of bar diagram, where the class intervals are shown on the horizontal axis and the heights of the bars (rectangles) show the frequency of the class interval, but there is no gap between the bars as there is no gap between the class intervals.
Q.82. Given below is a frequency distribution table. Read it and answer the question that follow.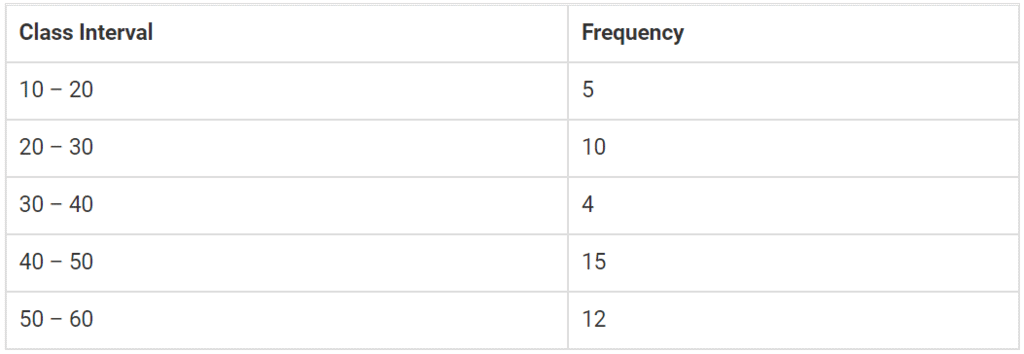
(a) What is the lower limit of the second class interval?
Solution: The lower limit of the second class interval 20 – 30 is 20.
(b) What is the upper limit of the last class interval?
Solution: The upper limit of the last class interval 50 – 60 is 60.
(c) What is the frequency of the third class?
Solution: The frequency of the third class 30 – 40 is 4.
(d) Which interval has a frequency of 10?
Solution: Second class interval 20 – 30 has a frequency of 10.
(e) Which interval has the lowest frequency?
Solution: Third interval 30 – 40 has the lowest frequency i.e. 4.
(f) What is the class size?
Solution: The difference between the upper and lower limit of a class interval is called the Size of the class interval.
Size = Upper limit – Lower limit
= 20 – 10
= 10
Q.83. The top speeds of thirty different land animals have been organised into a frequency table. Draw a histogram for the given data.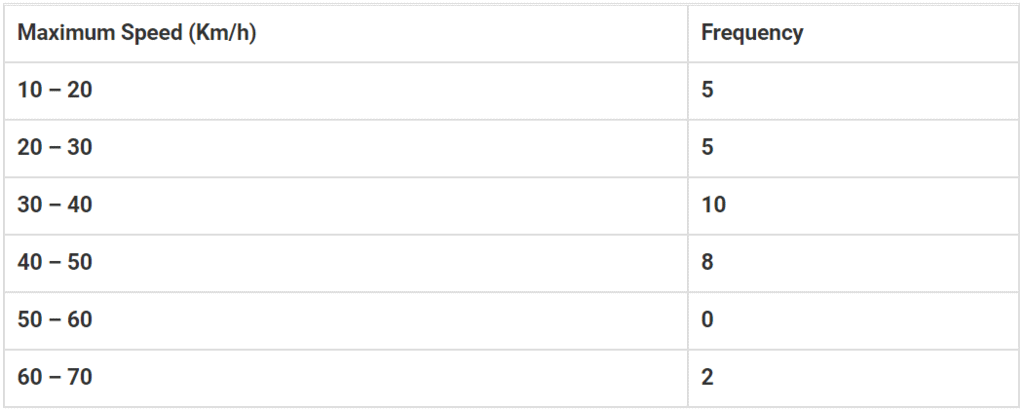
Solution: Histogram is a type of bar diagram, where the class intervals are shown on the horizontal axis and the heights of the bars (rectangles) show the frequency of the class interval, but there is no gap between the bars as there is no gap between the class intervals.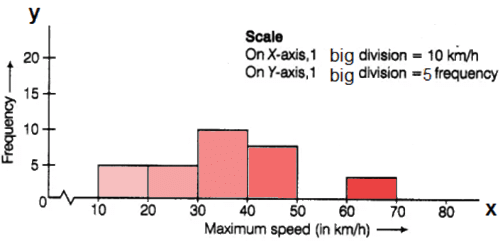
Q.84. Given below is a pie chart showing the time spend by a group of 350 children in different games. Observe it and answer the questions that follow.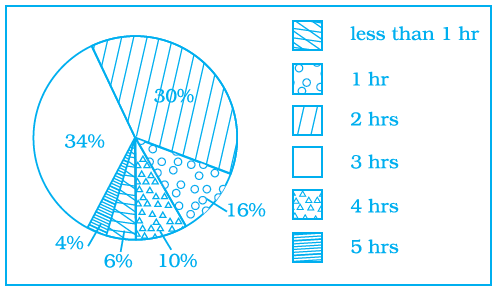
(a) How many children spend at least one hour in playing games?
Solution: From the given pie chart,
Percentage of children who at least spend one hour in playing = 16 + 30 + 34 + 10 + 4
= 94 %
Number of children out of 350 who at least spend one hour in playing = (94/100) × 350
= 0.94 × 350
= 329 children
(b) How many children spend more than 2 hours in playing games?
Solution: From the given pie chart,
Percentage of children who spend 2 hours in playing = 34 + 10 + 4
= 48 %
Number of children out of 350 who at least spend one hour in playing = (48/100) × 350
= 0.48 × 350
= 168 children
(c) How many children spend 3 or lesser hours in playing games?
Solution: From the given pie chart,
Percentage of children who at least spend one hour in playing = 6 + 16 + 30 + 34
= 86 %
Number of children out of 350 who at least spend one hour in playing = (86/100) × 350
= 0.86 × 350
= 301 children
(d) Which is greater — number of children who spend 2 hours or more per day or number of children who play for less than one hour?
Solution: Number of children who spend 2 hours or more per day = 30 + 34 + 10 + 4 = 78%
= (78/100) × 350
= 0.78 × 350
= 273 children
Number of children who play for less than one hour = 6%
= (6/100) × 350
= 0.06 × 350
= 21 children
So, by comparing both it is clear that number of children who spend 2 hours or more per day is greater
Q.85. The pie chart on the right shows the result of a survey Carried out to find the modes of travel used by the children to go to school. Study the pie chart and answer the questions that follow.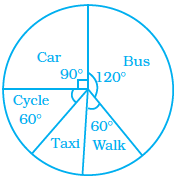
(a) What is the most common mode of transport?
Solution: By observing the given pie chart the most common mode of transport is Bus i.e. its central angle is 120o.
(b) What fraction of children travel by car?
Solution: By observing the given pie chart, central angle of the children travel by car is 90o.
Then,
The fraction of children travel by car,
= (90o/360o)
= 9/36 … [divide both numerator and denominator by 9]
= ¼
(c) If 18 children travel by car, how many children took part in the survey?
Solution: Let us assume total number of children took part in the survey be y
Number of children travel by car = (¼) of total number of children
18 = ¼ × y
Y = 18 × 4
Y = 72
So, 72 children took part in the survey.
(d) How many children use taxi to travel to school?
Solution: Central angle of children use taxi to travel to school = (360o – (120o + 60o + 90o + 60o)
= (360o – 330o)
= 30o
Then,
Out of 72 children number of children use taxi to travel to school = (30o/360o) × 72
= 6
(e) By which two modes of transport are equal number of children travelling
Solution: By observing the given pie chart, cycle and walk are the two modes of transport are equal number of children travelling. Because, central angle of the two modes are same i.e. 60o.
Q.86. A dice is rolled once. What is the probability that the number on top will be
(a) Odd
(b) Greater than 5
(c) A multiple of 3
(d) Less than 1
(e) A factor of 36
(f) A factor of 6
Solution: A dice is rolled once, the possible outcomes are 1, 2, 3, 4, 5 and 6.
Then,
The probability that the number on top will be
(a) Odd
Odd numbers in the dice are 1, 3, 5
Then,
Probability = total number of odd numbers/ Total number of outcomes
= 3/6 … [divide numerator and denominator by 3]
= ½
(b) Greater than 5
Greater than 5 is 6
Then,
Probability = total number Greater than 5/ Total number of outcomes
= 1/6
(c) A multiple of 3
Multiple of 3 = 3 and 6
Then,
Probability = total number of multiple of 3/ Total number of outcomes
= 2/6 … [divide numerator and denominator by 2]
= 1/3
(d) Less than 1
There is no number is less than 1.
So, probability of less than 1 = 0
(e) A factor of 36
Factors of 36 are 1, 2, 3, 4 and 6
Probability = total number of factor of 36/ Total number of outcomes
= 5/6
(f) A factor of 6
Factors of 6 are 1, 2, 3 and 6
Probability = total number of factor of 6/ Total number of outcomes
= 4/6 … [divide numerator and denominator by 2]
= 2/3
Q.87. Classify the following statements under appropriate headings.
(a) Getting the sum of angles of a triangle as 180°.
(b) India winning a cricket match against Pakistan.
(c) Sun setting in the evening.
(d) Getting 7 when a die is thrown.
(e) Sun rising from the west.
(f) Winning a racing competition by you.
Solution:
(a) It is certain to happen. Because, the sum of angles of a triangle as 180o.
(b) It may or may not happen. Because, the result of match is unpredictable.
(c) It is certain to happen. Because, the sun always sets in the evening.
(d) It is impossible to happen. Because, 7 is not an outcome when a dice is thrown.
(e) It is impossible to happen. Because, Sun always rises from the east.
(f) It may or may not happen. Because, the result is unpredictable.
Q.89. Ritwik draws a ball from a bag that contains white and yellow balls. The probability of choosing a white ball is 2/9. If the total number of balls in the bag is 36, find the number of yellow balls.
Solution: From the question is given that,
Probability of choosing a white ball is = 2/9
The total number of balls in the bag is = 36
Number of white ball chosen = (2/9) × 36
= 8 white balls
Then, the number of yellow balls = Total balls in bag – number of white balls
= 36 – 8
= 28 yellow balls
Q.90. Look at the histogram below and answer the questions that follow.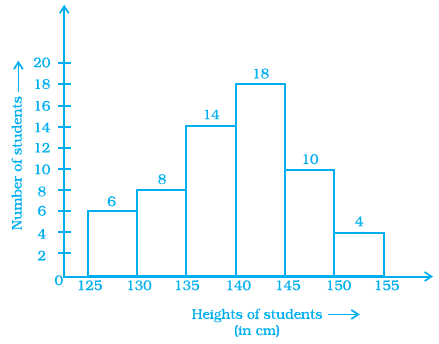
(a) How many students have height more than or equal to 135 cm but less than 150 cm?
Solution: By observing the given histogram,
Students have height more than or equal to 135 cm but less than 150 = 14 + 18 + 10
= 42
(b) Which class interval has the least number of students?
Solution: 150 – 155 has the least number of students i.e. 4.
(c) What is the class size?
Solution: The difference between the upper and lower limit of a class interval is called the
Size of the class interval.
Size = Upper limit – Lower limit
= 130 – 125
= 5
(d) How many students have height less than 140 cm?
Solution: By observing the given histogram,
Students have height less than 140 cm = 6 + 8 + 14
= 28
Q.91. Following are the number of members in 25 families of a village:
6, 8, 7, 7, 6, 5, 3, 2, 5, 6, 8, 7, 7, 4, 3, 6, 6, 6, 7, 5, 4, 3, 3, 2, 5. Prepare a frequency distribution table for the data using class intervals 0 –2, 2 –4, etc.
Solution: First, we have to arrange the number of members in 25 families of a village ascending order.
= 2, 2, 3, 3, 3, 3, 4, 4, 5, 5, 5, 5, 6, 6, 6, 6, 6, 6, 7, 7, 7, 7, 7, 8, 8.
Now, we will draw the frequency table of the given data.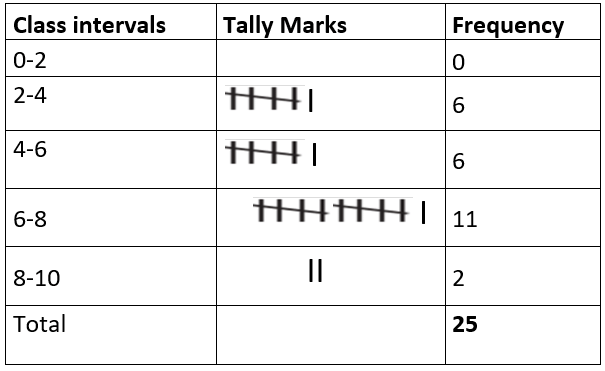
Q.92. Draw a histogram to represent the frequency distribution in question 91.
Solution: Scale:
On X – axis, 1 big division = 2 member
On Y – axis, 1 big division = 2 family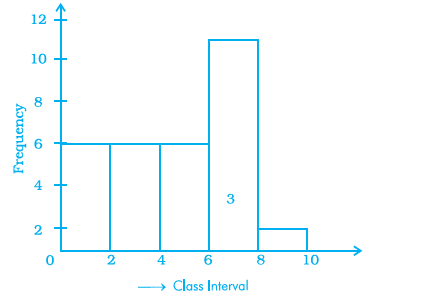
Q.93. The marks obtained (out of 20) by 30 students of a class in a test are as follows:
14, 16, 15, 11, 15, 14, 13, 16, 8, 10, 7, 11, 18, 15, 14, 19, 20, 7, 10, 13, 12, 14, 15, 13, 16,
17, 14, 11, 10, 20.
Prepare a frequency distribution table for the above data using class intervals of equal width in which one class interval is 4 –8 (excluding 8 and including 4).
Solution: First, we have to arrange marks obtained (out of 20) by 30 students in an ascending order.
= 7, 7, 8, 10, 10, 10, 11, 11, 11, 12, 13, 13, 13, 14, 14, 14, 14, 14, 15, 15, 15, 15, 16, 16, 16, 17, 18, 19, 20, 20.
Now, we will draw the frequency table of the given data.
Q.94. Prepare a histogram from the frequency distribution table obtained in question 93.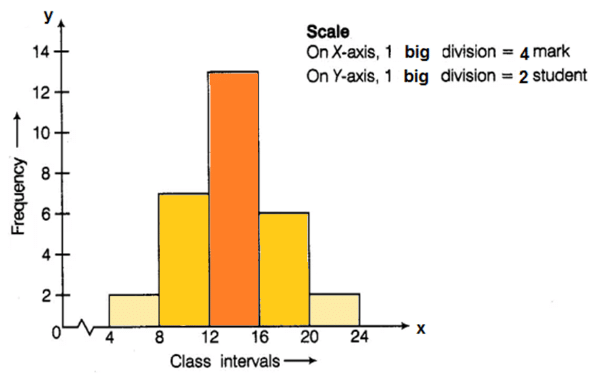
Solution: Scale:
On X – axis, 1 big division = 4 marks
On Y – axis, 1 big division = 2 students
Q.95. The weights (in kg) of 30 students of a class are:
39, 38, 36, 38, 40, 42, 43, 44, 33, 33, 31, 45, 46, 38, 37, 31, 30, 39, 41, 41, 46, 36, 35, 34, 39, 43, 32, 37, 29, 26.
Prepare a frequency distribution table using one class interval as (30 – 35), 35 not included.
(i) Which class has the least frequency?
(ii) Which class has the maximum frequency?
Solution: First, we have to arrange the weights (in kg) of 30 students of a class in an ascending order.
= 26, 29, 30, 31, 31, 32, 33, 33, 34, 35, 36, 36, 37, 37, 38, 38, 38, 39, 39, 39, 40, 41, 41, 42, 43, 43, 44, 45, 46, 46
Now, we will draw the frequency table of the given data.
(i) Class first has the least frequency.
(ii) Class third has the maximum frequency.
Q.96. Shoes of the following brands are sold in Nov. 2007 at a shoe store. Construct a pie chart for the data.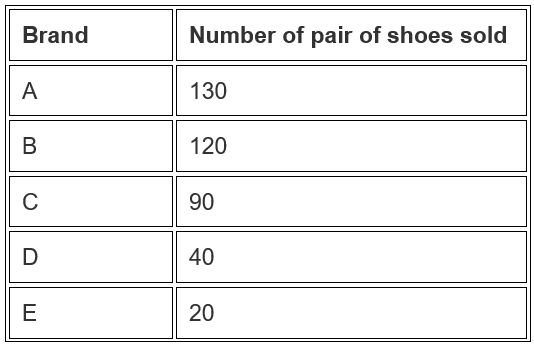
Solution: From the table,
Total number of pairs of shoes sold = 130 + 120 + 90 + 40 +20
= 400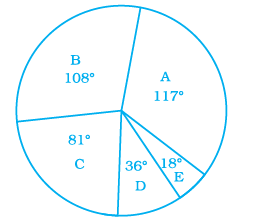
Central angle of pie chart for each brands,
A = (130/400) × 360o
= 117o
B = (120/400) × 360o
= 108o
C = (90/400) × 360o
= 81o
D = (40/400) × 360o
= 36o
E = (20/400) × 360o
= 18o
Q.97. The following pie chart depicts the expenditure of a state government under different heads.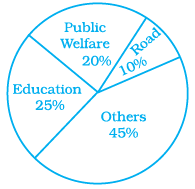
(i) If the total spending is 10 crores, how much money was spent on roads?
Solution: Given, total amount spent by state government under different heads = 10 crores
From the given pie chart,
Percentage of money spent on Roads = 10 %
Total money spent on Roads = (10/100) × 100000000
= 1,00,00,000
(ii) How many times is the amount of money spent on education compared to the amount spent on roads?
Solution: Given, total amount spent by state government under different heads = 10 crores
From the given pie chart,
Percentage of money spent on Roads = 10 %
Total money spent on Roads = (10/100) × 100000000
= ₹ 1,00,00,000
Percentage of money spent on Education = 25 %
Total money spent on Education = (25/100) × 100000000
= ₹ 2,50,00,000
Then,
= Total money spent on Education/ Total money spent on Roads
= ₹ 2,50,00,000/₹ 1,00,00,000
= ₹ 25/10
∴ Money spent on education is 2.5 times of money spent on roads.
(iii) What fraction of the total expenditure is spent on both roads and public welfare together?
Solution: Given, total amount spent by state government under different heads = 10 crores
From the given pie chart,
Percentage of money spent on Roads = 10 %
Percentage of money spent on Public Welfare = 20 %
So,
Fraction of the total expenditure is spent on both roads and public welfare together,
= 10% + 20%
= (10/100) + (20/100)
= (1/10) + (2/10)
= (3/10)
Q.98. The following data represents the different number of animals in a zoo. Prepare a pie chart for the given data.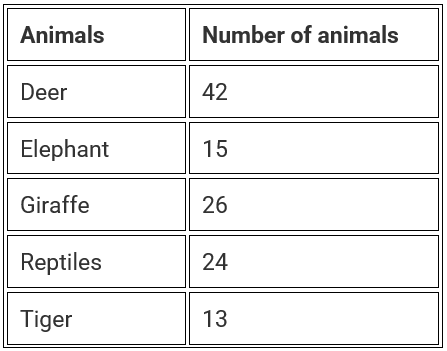
Solution: From the table,
Total number of animals in a zoo = 42 + 15 + 26 + 24 +13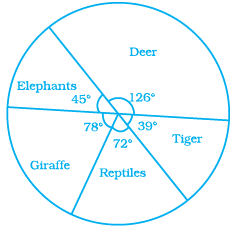
= 120
Central angle of pie chart for each animals,
Deer= (42/120) × 360o
= 126o
Elephant = (15/120) × 360o
= 45o
Giraffe = (26/120) × 360o
= 78o
Reptiles = (24/120) × 360o
= 72o
Tiger = (13/120) × 360o
= 39o
Q.99. Playing cards
(a) From a pack of cards the following cards are kept face down:
[Queen, King and Jack cards are called face cards.]
Suhail wins if he picks up a face card. Find the probability of Suhail winning
Solution: From the above figure,
Number of face cards = 1
Total number of cards = 7
Number of outcomes = 7
Probability = Number of face cards / Total number cards
= 1/7
(b) Now the following cards are added to the above cards:
What is the probability of Suhail winning now? Reshma wins if she picks up a 4. What is the probability of Reshma winning?
[Queen, King and Jack cards are called face cards.]
Solution: Number of face cards = 4
Total number of cards = 15
Number of outcomes = 15
Probability = Number of face cards / Total number cards
= 4/15
Q.100. Construct a frequency distribution table for the following weights (in grams) of 35 mangoes, using the equal class intervals, one of them is 40 – 45 (45 not included).
30, 40, 45, 32, 43, 50, 55, 62, 70, 70, 61, 62, 53, 52, 50, 42, 35, 37, 53, 55, 65, 70, 73, 74, 45, 46, 58, 59, 60, 62, 74, 34, 35, 70, 68.
(a) How many classes are there in the frequency distribution table?
(b) Which weight group has the highest frequency?
Solution: First, we have to arrange weights (in grams) of 35 mangoes in an ascending order.
= 30, 32, 34, 35, 35, 37, 40, 42, 43, 45, 45, 46, 50, 50, 52, 53, 53, 55, 55, 58, 59, 60, 61, 62, 62, 62, 65, 68, 70, 70, 70, 70, 73, 74, 74.
Now, we will draw the frequency table of the given data.
(a) There are nine classes in the frequency distribution table.
(b) 70 – 75 weight has the highest frequency.
Q.101. Complete the following table:
Find the total number of persons whose weights are given in the above table.
Solution:
Q.102. Draw a histogram for the following data.
Solution: Scale:
On X – axis, 1 big division = 5 marks
On Y – axis, 1 big division = 10 students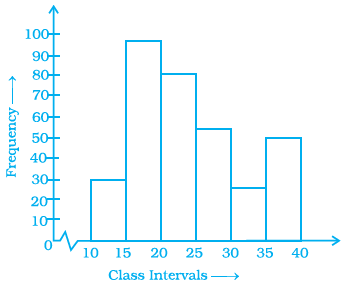
Q.103. In a hypothetical sample of 20 people, the amount of money (in thousands of rupees) with each was found to be as follows:
114, 108, 100, 98, 101, 109, 117, 119, 126, 131, 136, 143, 156, 169, 182, 195, 207, 219, 235, 118.
Draw a histogram of the frequency distribution, taking one of the class intervals as 50 –100.
Solution: From the data given in the question, first we have to prepare frequency distribution table,
Scale:
On X – axis, 1 big division = 50 ₹ marks
On Y – axis, 1 big division = 2 persons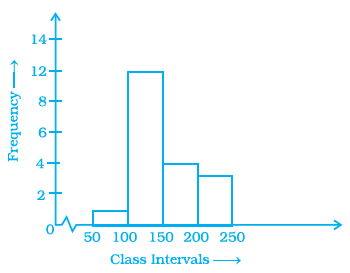
Q.104. The below histogram shows the number of literate females in the age group of 10 to 40 years in a town.
(a) Write the classes assuming all the classes are of equal width.
(b) What is the classes width?
(c) In which age group are literate females the least?
(d) In which age group is the number of literate females the highest?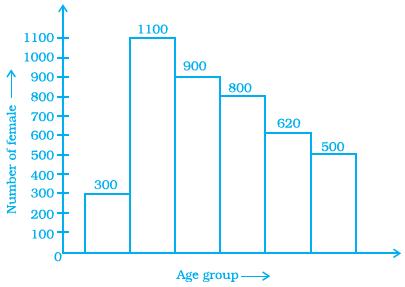
Solution: (a) The classes are, 10-15, 15-20, 20-25, 25-30, 30-35, and 35-40
(b) The class width is 15 – 10 = 5
(c) In the class first group i.e. 10-15 have the least female literate.
(d) In the class second group i.e. 15-20 have the highest female literate.
Q.105. The following histogram shows the frequency distribution of teaching experiences of 30 teachers in various schools: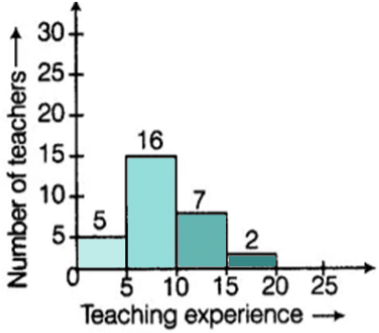
(a) What is the class width?
Solution: The width of the class is 5.
(b) How many teachers are having the maximum teaching experience and how many have the least teaching experience?
Solution: Teachers having maximum teaching experience is 2 and Teachers having least teaching experience is 5.
(c) How many teachers have teaching experience of 10 to 20 years?
Solution: Teachers have teaching experience of 10 to 20 years is 7 + 2 = 9.
Q.106. In a district, the number of branches of different banks is given below:
Draw a pie chart for this data.
Solution: From the table,
Total number of branches of different bank in a district = 30 + 17 + 15 + 10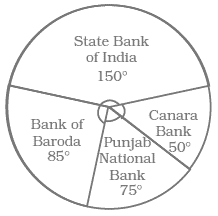
= 72
Central angle of pie chart for each bank,
State Bank of India = (30/72) × 360o
= 150o
Bank of Baroda = (17/72) × 360o
= 85o
Punjab National bank = (15/72) × 360o
= 75o
Canara Bank = (10/72) × 360o
= 50o
Q.107. For the development of basic infrastructure in a district, a project of Rs 108 crore approved by Development Bank is as follows:
Draw a pie chart for this data.
Solution: From the question,
Total number approved = 108 crore
Central angle of pie chart for each infrastructure,
Road = (43.2/108) × 360o
= 144o
Electricity = (16.2/108) × 360o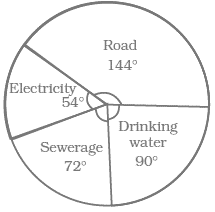
Drinking water = (27/108) × 360o
= 90o
Sewerage = (21.6/108) × 360o
= 72o
Q.108. In the time table of a school, periods allotted per week to different teaching subjects are given below:
Draw a pie chart for this data.
Solution: From the question,
Total number periods allotted = 7 + 8 + 8 + 8 + 7 + 4 + 3 = 45 periods
Central angle of pie chart for each subject,
Hindi = (7/45) × 360o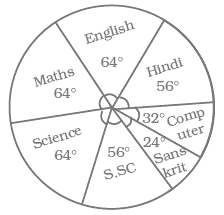
= 56o
English = (8/45) × 360o
= 64o
Maths = (8/45) × 360o
= 64o
Science = (8/45) × 360o
= 64o
Social Science = (7/45) × 360o
= 56o
Computer = (4/45) × 360o
= 32o
Sanskrit = (3/45) × 360o
= 24o
Q.109. A survey was carried out to find the favorite beverage preferred by a certain group of young people. The following pie chart shows the findings of this survey. From this pie chart answer the following: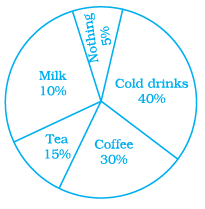
(i) Which type of beverage is liked by the maximum number of people.
Solution: Cold drink is liked by the maximum number of people.
(ii) If 45 people like tea, how many people were surveyed?
Solution: From the question it is given that,
45 people like tea
Then,
Let us assume total number of people surveyed be x,
= 45 = (15/100) × (x)
= 45 = 0.15x
= x = 45/0.15
= x = 300
So, the total number of people surveyed is 300.
Q.110. The following data represents the approximate percentage of water in various oceans. Prepare a pie chart for the given data.
Pacific 40%
Atlantic 30%
Indian 20%
Others 10%
Solution: The central angle of the given approximate percentage of water in various oceans,
Pacific = (40/100) × 360o
= 144o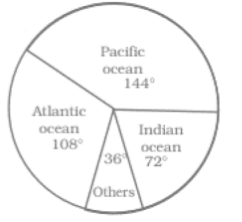
Atlantic = (30/100) × 360o
= 108o
Indian = (20/100) × 360o
= 72o
Others = (10/100) × 360o
= 36o
Q.111. At a Birthday Party, the children spin a wheel to get a gift. Find the probability of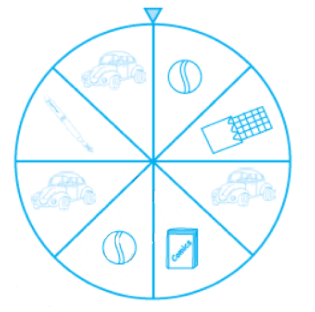
(a) getting a ball
Solution: Number of balls in wheel = 2
Total number of gifts = 8
Probability of getting a ball = Number of balls in wheel/ total number of gifts
= 2/8 … [divide both by 2]
= 1/4
(b) getting a toy car
Solution: Number of cars in wheel = 3
Total number of gifts = 8
Probability of getting a ball = Number of balls in wheel/ total number of gifts
= 3/8
(c) any toy except a chocolate
Solution: Number of toys except a chocolate = 7
Total number of gifts = 8
Probability of getting a ball = Number of balls in wheel/ total number of gifts
= 7/8
Q.112. Sonia picks up a card from the given cards.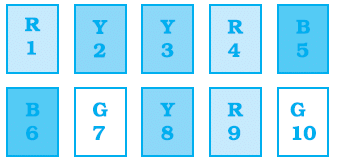
Calculate the probability of getting
(a) an odd number
Solution: Total number of odd numbers in given cards = 5
Total number of cards = 10
Probability of getting an odd number = Total number of odd numbers/ total number of cards
= 5/10
= ½
(b) a Y card
Solution: Total number of y cards = 3
Total number of cards = 10
Probability of getting a Y card = Total number of Y cards/ total number of cards
= 3/10
(c) a G card
Total number of G cards = 2
Total number of cards = 10
Probability of getting a Y card = Total number of Y cards/ total number of cards
= 2/10
= 1/5
(d) B card bearing number > 7
Total number B card bearing number > 7= 0
Total number of cards = 10
Probability of getting a Y card = Total number B card bearing number > 7/ total number of cards
= 0/10
= 0
Q.113. Identify which symbol should appear in each sector in 113, 114.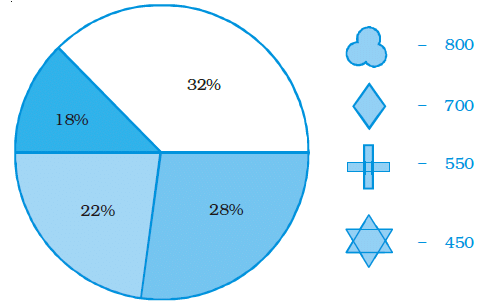
Solution: From the given figure,
Total number of symbol = 800 + 700 + 550 + 450 = 2500
Then,
(i) = (32/100) × 2500
Q.114.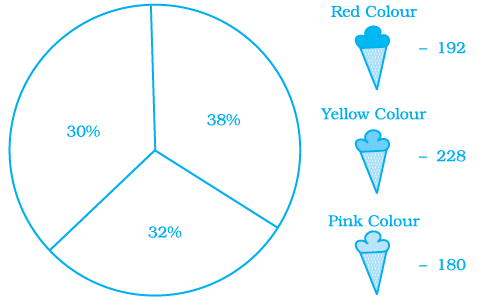
Solution: From the given figure,
Total number of ice-creams = 192 + 228 + 180 = 600
Then,
(i) = (38/100) × 600
= 228
∴  yellow colour ice-cream should appear in sector having 38%.
(ii) = (32/100) × 600
= 192
∴  red colour ice-cream should appear in sector having 32%.
(iii) = (30/100) × 600
= 180
∴  pink colour icecream should appear in sector having 30%.
Q.115. A financial counselor gave a client this pie chart describing how to budget his income. If the client brings home Rs. 50,000 each month, how much should he spend in each category?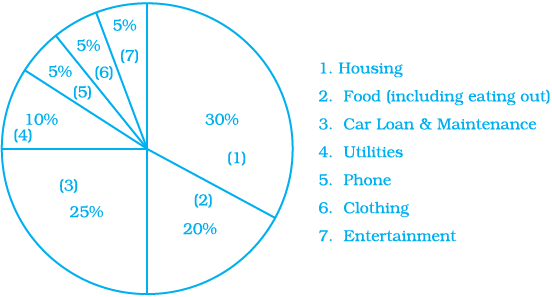
Solution: From the question it is given that,
Total money spent on 7 categories = Rs. 50,000
Then,
(1) Money spent on Housing = (30/100) × 50,000
= Rs. 15,000
(2) Money spent on Food (including eating out) = (20/100) × 50,000
= Rs. 10,000
(3) Money spent on Car Loan and Maintenance = (25/100) × 50,000
= Rs. 12,500
(4) Money spent on Utilities = (10/100) × 50,000
= Rs. 5,000
(5) Money spent on Phone = (5/100) × 50,000
= Rs. 2,500
(6) Money spent on Clothing = (5/100) × 50,000
= Rs. 2,500
(7) Money spent on Entertainment = (5/100) × 50,000
= Rs. 2,500
Q.116. Following is a pie chart showing the amount spent in rupees (in thousands) by a company on various modes of advertising for a product.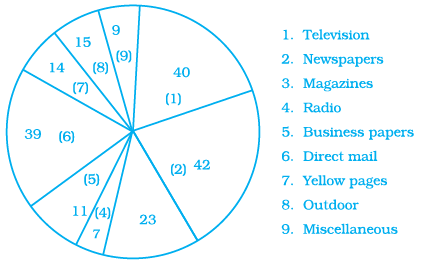
Now answer the following questions.
(i) Which type of media advertising is the greatest amount of the total?
Solution: From the given figure,
The type of media advertising is the greatest amount of the total is Newspaper.
(ii) Which type of media advertising is the least amount of the total?
Solution: From the given figure,
The type of media advertising is the least amount of the total is Radio.
(iii) What per cent of the total advertising amount is spent on direct mail campaigns?
Solution: From the given figure,
Total amount spent by a company on various modes of advertising for a product,
= 40 + 42 + 23 + 7 + 11 + 39 + 14 + 15 + 9
= Rs. 200
Then,
Per cent of the total advertising amount is spent on direct mail campaigns
= (39/200) × 100
= 19.5%
(iv) What per cent of the advertising amount is spent on newspaper and magazine advertisements?
Solution: From the given figure,
Total amount spent by a company on various modes of advertising for a product,
= 40 + 42 + 23 + 7 + 11 + 39 + 14 + 15 + 9
= Rs. 200
Then,
Per cent of the total advertising amount is spent on newspaper and magazine
= ((42 + 23)/200) × 100
= (65/200) × 100
= 32.5%
(v) What media types do you think are included in miscellaneous?
Why aren’t those media types given their own category?
Solution: Internet and web-media are included in miscellaneous.
|
79 videos|408 docs|31 tests
|
FAQs on NCERT Exemplar Solutions: Data Handling - Mathematics (Maths) Class 8
| 1. What is the importance of data handling in Class 8? |  |
| 2. How can data handling be applied in everyday life? |  |
| 3. What are the different types of data used in data handling? |  |
| 4. How can data be represented visually in data handling? |  |
| 5. What are the steps involved in data handling? |  |


