Important Questions: Data Handling

Q1: The number of hours the students of a particular class have watched television during holidays is shown in the graph given below. Answer the following questions:
(a) How many hours did the maximum number of students watch T.V.?
(b) How many students have watched T.V. for less than 4 hours?
(c) How many students have spent more than 5 hours watching T.V.?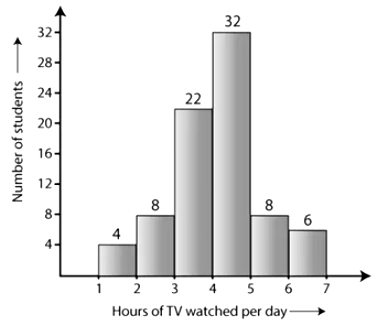
Ans: (a) 32 students have watched T.V. for 4-5 hours.
Sol:
Therefore, the maximum number of students who have watched T.V. for 4 - 5 hours.
(ii) The number of students who have watched T.V. for less than 4 hours = 22 + 8 + 4 = 34
(iii) The number of students who have spent more than 5 hours watching T.V. = 8 + 6 = 14
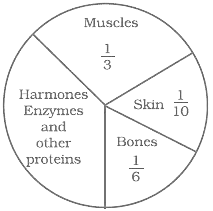
Q2: What is the central angle of the given sector (in the above pie chart) representing skin and bones together?
(a) 36°
(b) 60°
(c) 90°
(d) 96°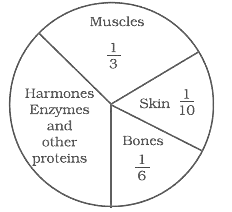
Ans: (d)
Sol: Distribution of protein in the skin = 1/10
Distribution of protein in the bones = 1/6
The central angle of the sector represents skin and bones,
= 1/10 + 1/6
= (3 + 5)/30
= 8/30 × 360°
= 96°
Q3: (a) Find out the probability at which the pointer stops on D.
(b) Find the probability of getting any ace from a well-shuffled deck of 52 playing cards.
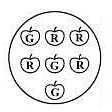
(c) Find the probability of getting any red apple. (See figure below)
Sol:
(a) In a given spinning wheel, there are five pointers A, A, B, C, D. So, we obtain five outcomes. The pointer stops at D, which is also one of the outcomes.
So the probability of the pointer to stop on D = 1/5
(b) There are 4 aces in a given deck of 52 playing cards. So there are four events for obtaining any ace.
So, the probability of getting any ace = 4/52 = 1/13
(c) Total number of apples = 7
Number of red apples = 4
The probability of getting any red apple from the given figure = 4/7
Q4: The pie chart given below shows the distribution of constituents in the human body. The central angle of the given sector showing the distribution of protein and other constituents is
(a) 108°
(b) 54°
(c) 30°
(d) 216°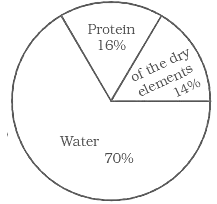
Ans: (a)
The pie chart given above shows us the distribution of constituents in the human body
= 16% + 14% = 30%
= (30/100) × 360v
= 108°
Q5: When a die is thrown, list the number of outcomes of an event of getting
(i) (a) a prime number (b) not a prime number.
(ii) (a) a number greater than 5 (b) a number not greater than 5.
Sol:
(i) (a) The outcomes of the event of getting a prime number are 2, 3 and 5.
(b) The outcomes of the event of not getting any prime numbers are 1, 4 and 6.
(ii) (a) The outcome of the event of getting a number greater than 5 is 6.
(b) The outcomes of the event of not getting a number greater than 5 are 1, 2, 3, 4 and 5.
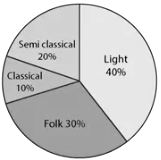
Q6: A survey was conducted to research the type of music that a certain group of young people enjoyed in a city. The adjoining pie chart exhibits the findings of this survey. From the given pie chart, answer the following questions below:
(i) If 20 people enjoyed classical music, how many young people were surveyed?
(ii) Which is the type of music liked by the maximum number of young people?
(iii) If a cassette company were to make 1000 CDs, how many of each type would they make?
Sol:
(i) 10% represents 20 people.
100% represents = (100 x 20)/10
= 200
Therefore, 200 young people were surveyed.
(ii) Since 40% of the total young people surveyed enjoyed listening to light music and no other form of music was liked more than that, we can conclude that the maximum number of young people liked light music.
(iii) CD's of classical music = (10 x 1000)/100 = 100
CD's of semi-classical music = (20 x 1000)/100 = 200
CD's of light music = (40 x 1000)/100 = 400
CD's of folk music = (30 x 1000)/100 = 300
Q7: The monthly salary of an average person is Rs. 15,000. The central angle of the given sector representing his expenses on food and house rent on a pie chart is 60°. The amount he spends on his food and house rent is
(a) Rs. 5000
(b) Rs. 2500
(c) Rs. 6000
(d) Rs. 9000
Ans: (b)
Sol: From the question,
The part of the monthly salary spent on food and house rent = 60°/360°
The amount he spends on his food and house rent is = (60°/360°) × 15000
= Rs. 2500
Q8: The numbers from 1 to 10 are written on ten separate slips (one number on each slip) and are kept in a box and mixed well. One slip is chosen from the box without looking into it. What is the probability of:
(i) getting the number 6?
(ii) getting a number less than 6?
(iii) getting a number greater than 6?
(iv) getting a 1-digit number?
Sol:
(i) The outcome of getting exactly the number 6 from ten separate slips is one.
Therefore, the probability of getting exactly the number 6 = 1/10
(ii) The numbers that are less than 6 are as follows 1, 2, 3, 4 and 5. So the total number of numbers is five. Thus, we get 5 outcomes.
Therefore, the probability of getting any number less than 6 = 5/10
= 1/2
(iii) The number that is greater than 6 out of ten are as follows 7, 8, 9, 10. So, we obtain 4 possible outcomes.
Therefore, the probability of getting any number greater than 6 = 4/10
= 2/5
(iv) The one-digit numbers out of 1 to 10 are as follows 1, 2, 3, 4, 5, 6, 7, 8, 9.
Therefore, the probability of getting any 1-digit number = 9/10.
Q9: The pie chart represents the distribution of proteins in human body parts. What is the ratio of the distribution of proteins in the muscles to that of proteins in the bones?
(a) 3: 1
(b) 1: 2
(c) 1: 3
(d) 2: 1
Ans: (d)
From the chart,
The distribution of protein in the muscles = 1/3
The distribution of protein in the bones = 1/6
Then,
The ratio of the distribution of the amount of proteins in the muscles to that of proteins in the bones,
= 1/3: 1/6
= (1/3) × (6/1)
= (1/1) × (2/1)
= 2/1
= 2: 1
Q10: If you own a spinning wheel with 3 green sectors, 1 blue sector and 1 red sector, what is the probability of a green sector being present? What is the probability of getting a single non-blue sector?
Sol: A total of sectors present are five. Out of the five present sectors, three sectors are green.
Therefore, the probability green of a sector being present = 3/5.
Out of the five present sectors, one of those sectors is blue.
Hence, the number of amount on-blue sectors = 5 - 1
= 4 sectors.
Therefore, the probability of getting a single non-blue sector present will be equal to 4/5.
FAQs on Important Questions: Data Handling
| 1. What is data handling and why is it important? |  |
| 2. What are the common challenges in data handling? | |
| 3. How can data handling techniques help in improving data accuracy? | |
| 4. What are some common methods used for data handling? | |
| 5. What are the potential risks of inadequate data handling? | |


