Statistical series, Business Mathematics & Statistics | Business Mathematics and Statistics - B Com PDF Download
TYPES OF SERIES AND FREQUENCY DISTRIBUTION
Broadly speaking, the statistical series are of two types viz.
(i) Time series and
(ii) Frequency series.
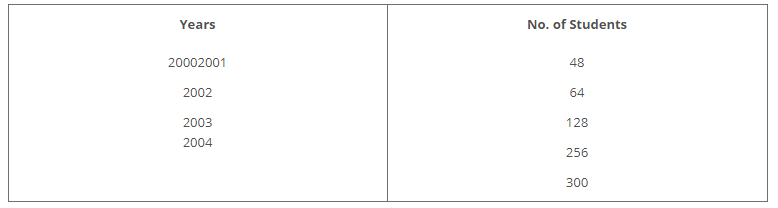
Time Series
A series of data that is arranged chronologically, or in relation to time is called a Time Series. The following is an example of a Time Series.
Example:
Frequency Series
A series of data that is formed along with the frequencies of their occurrences is called a frequency series. A frequency series is again, of three types viz.
1. Individual series
2. Discrete series, and
3. Continuous series.
Individual Series
An individual series is one in which each value of the variable occurs for only once. In other words, the frequency of occurrence of all the values in such a series is only one. As such, essentially such series are displayed without the frequency column. The following are the examples of individual series.
Example1 Example2 Example 3
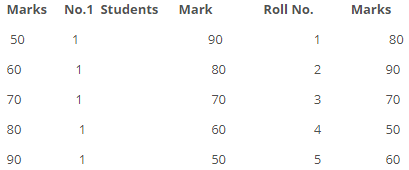
An individual series may be arranged either in ascending, or in descending, or in any other orders as it would suit the desired analysis. In the examples 1 above, the series has been arranged in ascending order, while in the example 3 above, the series has been arranged in order of the roll numbers of the students.
Array
When an individual series is arranged in some order i.e., ascending, or descending order, it is called an array.
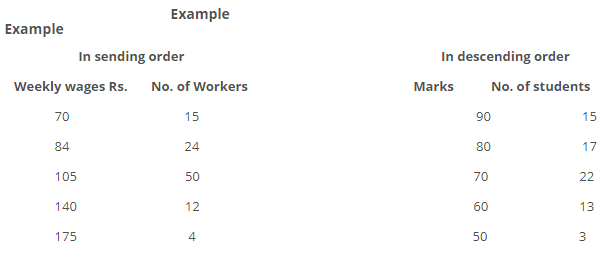
Discrete Series
A discrete series is one in which the different values of a variable are shown in a discontinuous manner along with their respective frequencies and at least one of the values has a frequency of more than one. Such a series can also be arranged either in ascending, or in descending order.
The following are the examples of discrete series.
Continuous Series
A continuous series is one which the different values of the variables are stated in a continuous manner along with their respective frequencies. Such series can be arranyed either in ascending, or in descending order. Further, such series can be stated either in the form exclusive, or in the from of inclusive class intervals along with their respective class frequencies. Furthermore, such series can also be presented either in non-cumulative, or in cumulative from (Less than, or more than) along with their respective frequencies.
|
115 videos|142 docs
|
FAQs on Statistical series, Business Mathematics & Statistics - Business Mathematics and Statistics - B Com
| 1. What are statistical series? |  |
| 2. How are statistical series useful in business mathematics and statistics? | |
| 3. What are the measures of central tendency used in statistical series analysis? | |
| 4. How can statistical series be used to identify outliers in business data? | |
| 5. Can statistical series be used to compare data from different time periods in business analysis? | |

|
1.7K Views |

|
4.73/5 Rating |

|
Dec 23, 2024 Last updated |

|
Explore Courses for B Com exam
|
|
shortcuts and tricks
,Previous Year Questions with Solutions
,MCQs
,Statistical series
,Important questions
,mock tests for examination
,study material
,Sample Paper
,Business Mathematics & Statistics | Business Mathematics and Statistics - B Com
,Free
,Extra Questions
,practice quizzes
,Semester Notes
,Statistical series
,Business Mathematics & Statistics | Business Mathematics and Statistics - B Com
,Summary
,Exam
,Objective type Questions
,Viva Questions
,past year papers
,Statistical series
,Business Mathematics & Statistics | Business Mathematics and Statistics - B Com
,video lectures
,ppt
;


Statistical series, Business Mathematics & Statistics Free PDF Download
Importance of Statistical series, Business Mathematics & Statistics
Statistical series, Business Mathematics & Statistics Notes
Statistical series, Business Mathematics & Statistics B Com Questions
Study Statistical series, Business Mathematics & Statistics on the App
|
© EduRev
|
Education Revolution
|


|


