
Best Study Material for SSC CGL Exam
SSC CGL Exam > SSC CGL Notes > SSC CGL Tier 2 - Study Material, Online Tests, Previous Year > Quartiles and Percentiles - Measures of Central Tendency, Business Mathematics & Statistics
Quartiles and Percentiles - Measures of Central Tendency, Business Mathematics & Statistics | SSC CGL Tier 2 - Study Material, Online Tests, Previous Year PDF Download
Quartiles and Percentiles
At this point we can describe the results of an experiment - at least for numeric variables - using the mean (or median) and the standard deviation. That will tell us the "center" of the distribution of values and the "spread" around that center. For example, if we measure the height of US army soldiers we could say that the average height of US soldiers is 1.73 meters, with a standard deviation of 0.15 meters (the numbers are made-up). To describe the distribution in more detail we need additional descriptive measures.
Upper and Lower Quartiles
- The Lower Quartile Q1 is that number such that 25% of observations are less than it and 75% are larger, or to be more precise, at least 25% of the sorted values are less than or equal to Q1and at least 75% of the values are greater than or equal to Q1.
- The Upper Quartile Q3 is that number such that 75% of observations are less than it and 25% are larger, or to be more precise, at least 75% of the sorted values are less than or equal to Q3, and at least 25% of the values are greater than or equal to Q3.
Following this notation, the median should actually be called the "middle quartile" Q2, since it is that number such that 50% are less than it and 50% are larger.
NOTE: To find the quartiles, you must first sort your data (similar to finding the mean).
Example: Compute the upper and lower quartiles of the numbers 1, 2, 3, 4, 5, 6, 7.
The numbers are already sorted, so that it is easy to see that the median is 4 (three numbers are less than 4 and three are bigger). In other words, 4 splits our numbers up into the smaller set {1, 2, 3} and the larger set {5, 6, 7}. The quartiles, in turn, split up these sets in the middle, so that Q1 = 2 and Q3 = 6.
Note that the numbers 1, 2 are less than or equal to the lower quartile, while 2, 3, 4, 5, 6, 7 are larger than or equal to Q1. Therefore, 2 out of 7 or 28% of values are less than or equal to Q1 and 6 out of 7 = 85% are larger than Q1.
Example: Compute the upper and lower quartiles of the numbers 1, 2, 3, 4, 5.
Now the median is 3, leaving two sets {1, 2} and {4, 5}. To split these numbers in the middle does not work, so it is not immediately clear what the quartiles are.
- If Q1= 1, then one value out of 5 is less than or equal to Q1, or 20%. That's not correct, so Q1 must be bigger than 1.
- If Q1 = 2, then two values out of 5 are less than or equal to Q1, or 40%. Similarly, 4 values out of 5 , or 80%, are larger than or equal to Q1 so that the lower quartile is 2.
Similarly, the upper quartile can be shown to be 4.
For larger data sets, the quartiles can be selected as follows:
For Lower Quartile;
- Sort all observations in ascending order
- Compute the position L1 = 0.25 * N, where N is the total number of observations.
- If L1 is a whole number, the lower quartile is midway between the L1-th value and the next one.
- If L1 is not a whole number, change it by rounding up to the nearest integer. The value at that position is the lower quartile.
For Upper Quartile;
- Sort all observations in ascending order
- Compute the position L3 = 0.75 * N, where N is the total number of observations.
- If L3 is a whole number, the lower quartile is midway between the L3-th value and the next one.
- If L3 is not a whole number, change it by rounding up to the nearest integer. The value at that position is the lower quartile.
Examples: Find the quartiles for the values 1, 2, 3, 4, 5, 6, 7 and also for the values 1, 2, 3, 4, 5 using this new method.
For the set 1, 2, 3, 4, 5, 6, 7 we have N = 7. Thus:
- L1 = 0.25 * 7 = 1.75, which gets rounded up to 2. Thus, I take the number in the 2nd position to be the lower quartile
- L3 = 0.75 * 7 = 5.25, which gets rounded up to 6. Thus, I take the 6th number (i.e. 6) to be the upper quartile.
For the set 1, 2, 3, 4, 5 we have N = 5. Thus:
- L1 = 0.25 * 5 = 1.25, which gets rounded up to 2. Thus, I again take the number in the 2nd position to be the lower quartile
- L3 = 0.75 * 5 = 3.75, which gets rounded up to 4. Thus, I take the 4th number (i.e. 4) to be the upper quartile.
Percentiles
Quartiles are useful and they help to describe the distribution of values as we will see later. However, we often want to know how one particular data value compares to the rest of the data. For example, when taking standardized test scores such as SAT scores, I want to know not only my own score, but also how my score ranks in relation to all scores. Percentiles are perfect for this situation.
The K-th Percentile is that number such that K % of all data values are less and (100 - K) % are larger than it, or to be more precise, at least K% of the sorted values are less than or equal to it and at least (100 - K) % of the values are greater than or equal to it.
Note: The lower quartile is the same as the 25th percentile, the median is the same as the 50th percentile, and the upper quartile is the same as the 75th percentile.
To find the K-th Percentile:
- Sort all observations in ascending order
- Compute the position L = (K/100) * N, where N is the total number of observations.
- If L is a whole number, the K-th percentile is the value midway between the L-th value and the next one.
- If L is not a whole number, change it by rounding up to the nearest integer. The value at that position is the K-th percentile.
Example: Consider the following cotinine levels of 40 smokers:
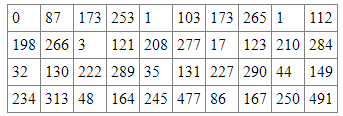
Find the quartiles and the 40th percentile.
First note that before we start our computations we must sort the data - computing percentiles for non-sorted data is the most common mistake (so please avoid it). Here is the same data again, this time sorted:
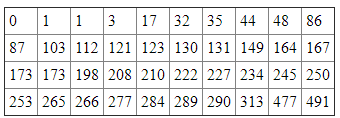
Now we can do our calculations, where N = 40 (number of values in our data set).
- Lower Quartile: 0.25 * 40 = 10, so we need to take the value midway between the 10th value, which is 86, and the 11th value, which is 87. Hence, the lower quartile is 86.5
- Upper Quartile: 0.75 * 40 = 30, so we need to take the value midway between the 30th value, which is 250, and the 31st value, which is 253. Hence, the upper quartile is (250 + 253) / 2 = 251.5
- 40th Percentile: 0.4 * 40 = 16, so the 40th percentile is (130 + 131) / 2 = 130.5
But for percentiles another question is usually asked: given a particular value, find that percentile that corresponds to this value. In other words, determine how many values are less and how many values are larger than the particular value.
To find the percentile that corresponds to a particular data value x is:
- percentile value of x = (number of values less than x) / (total number of values) * 100
Example: Suppose you took part in the above study of cotinine levels, and your personal continine level was 245. What is the percentile value of 245, and how many people in the study had a higher cotinine level that you?
First note that in our sorted data the value 245 is in 29th position (I must use the sorted data, of course). Therefore, according to our formula:
- percentile value of 245 = 29/40 * 100 = 72.5
Thus, by definition of percentiles, 72.5% of values are less than245, while (100 - 72.5) = 27.5% are larger than 245.
 |
Download the notes
Quartiles and Percentiles - Measures of Central Tendency, Business Mathematics & Statistics
|
Download as PDF |
Download as PDF
Using Excel to find Percentiles
Of course Excel can be used to find percentiles, and therefore upper and lower quartiles (which are just the 25th and 75th percentile, respectively).
The Excel function to compute percentiles is "= percentile(RANGE, K)", where RANGE is a range of cells and K is the percentile to compute as a decimal number between 0 and 1. The data does not have to be sorted, Excel can handle it automatically.
The Excel function to compute the rank of a value x in a data set as a percentage of the data set (in other words, the percentile value of x) is "=percentrank(RANGE, X)". The data does not have to be sorted, Excel can handle it automatically.
For example, the function "=percentile(A1:A10, 0.40)" computes the 40th percentile of the values in the cells A1 to A10.
The document Quartiles and Percentiles - Measures of Central Tendency, Business Mathematics & Statistics | SSC CGL Tier 2 - Study Material, Online Tests, Previous Year is a part of the SSC CGL Course SSC CGL Tier 2 - Study Material, Online Tests, Previous Year.
All you need of SSC CGL at this link: SSC CGL
|
1363 videos|1310 docs|1010 tests
|


FAQs on Quartiles and Percentiles - Measures of Central Tendency, Business Mathematics & Statistics - SSC CGL Tier 2 - Study Material, Online Tests, Previous Year
| 1. What are quartiles and how are they calculated? |  |
| 2. How do quartiles help in analyzing data? | |
Ans. Quartiles provide valuable insights into the distribution of data. They help us understand the central tendency and spread of a dataset. By examining quartiles, we can identify the range in which most of the data points lie, detect outliers, and evaluate the skewness of the distribution. Quartiles also assist in comparing different datasets and assessing the variability between them.
| 3. What is the significance of percentiles in statistics? | |
Ans. Percentiles are statistical measures that divide a dataset into hundred equal parts. They indicate the relative standing or position of a particular data point within the dataset. For example, the 75th percentile represents the value below which 75% of the data falls. Percentiles are particularly useful for comparing individual data points with the rest of the dataset and determining their relative importance or performance.
| 4. How are percentiles calculated? | |
Ans. To calculate percentiles, the dataset needs to be arranged in ascending order. The percentile position can be determined using the formula: P = (k/100) * (n+1), where P is the desired percentile, k is the specified percentage, and n is the total number of data points. If the computed value is not an integer, we can interpolate between the two nearest values in the dataset to find the precise percentile value.
| 5. Can quartiles and percentiles be used interchangeably? | |
Ans. No, quartiles and percentiles cannot be used interchangeably. While both measures divide a dataset into specific parts, quartiles divide it into four parts (25% each) and percentiles divide it into a hundred parts (1% each). Quartiles are commonly used to understand the spread and central tendency of data, while percentiles are used to determine the relative position of a data point within the dataset. Each measure provides distinct insights into the distribution and characteristics of the data.
Related Exams
About this Document

4.96/5
Rating

Jan 09, 2025
Last updated
Document Description: Quartiles and Percentiles - Measures of Central Tendency, Business Mathematics & Statistics for SSC CGL 2025 is part of SSC CGL Tier 2 - Study Material, Online Tests, Previous Year preparation.
The notes and questions for Quartiles and Percentiles - Measures of Central Tendency, Business Mathematics & Statistics have been prepared according to the SSC CGL exam syllabus. Information about Quartiles and Percentiles - Measures of Central Tendency, Business Mathematics & Statistics covers topics
like and Quartiles and Percentiles - Measures of Central Tendency, Business Mathematics & Statistics Example, for SSC CGL 2025 Exam. Find important definitions, questions, notes, meanings, examples, exercises and tests below for Quartiles and Percentiles - Measures of Central Tendency, Business Mathematics & Statistics.
Introduction of Quartiles and Percentiles - Measures of Central Tendency, Business Mathematics & Statistics in English is available as part of our SSC CGL Tier 2 - Study Material, Online Tests, Previous Year
for SSC CGL & Quartiles and Percentiles - Measures of Central Tendency, Business Mathematics & Statistics in Hindi for SSC CGL Tier 2 - Study Material, Online Tests, Previous Year course.
Download more important topics related with notes, lectures and mock test series for SSC CGL
Exam by signing up for free. SSC CGL: Quartiles and Percentiles - Measures of Central Tendency, Business Mathematics & Statistics | SSC CGL Tier 2 - Study Material, Online Tests, Previous Year
Description
Full syllabus notes, lecture & questions for Quartiles and Percentiles - Measures of Central Tendency, Business Mathematics & Statistics | SSC CGL Tier 2 - Study Material, Online Tests, Previous Year - SSC CGL | Plus excerises question with solution to help you revise complete syllabus for SSC CGL Tier 2 - Study Material, Online Tests, Previous Year | Best notes, free PDF download
Information about Quartiles and Percentiles - Measures of Central Tendency, Business Mathematics & Statistics
In this doc you can find the meaning of Quartiles and Percentiles - Measures of Central Tendency, Business Mathematics & Statistics defined & explained in the simplest way possible. Besides explaining types of
Quartiles and Percentiles - Measures of Central Tendency, Business Mathematics & Statistics theory, EduRev gives you an ample number of questions to practice Quartiles and Percentiles - Measures of Central Tendency, Business Mathematics & Statistics tests, examples and also practice SSC CGL
tests
|
1363 videos|1310 docs|1010 tests
|
Download as PDF

Related Searches
Previous Year
,past year papers
,Business Mathematics & Statistics | SSC CGL Tier 2 - Study Material
,Important questions
,Online Tests
,Quartiles and Percentiles - Measures of Central Tendency
,Online Tests
,ppt
,Quartiles and Percentiles - Measures of Central Tendency
,Previous Year
,Business Mathematics & Statistics | SSC CGL Tier 2 - Study Material
,Extra Questions
,Previous Year Questions with Solutions
,Summary
,MCQs
,video lectures
,Free
,Semester Notes
,practice quizzes
,Viva Questions
,Exam
,mock tests for examination
,Quartiles and Percentiles - Measures of Central Tendency
,study material
,shortcuts and tricks
,Business Mathematics & Statistics | SSC CGL Tier 2 - Study Material
,Sample Paper
,Online Tests
,Objective type Questions
,Previous Year
;


Additional Information about Quartiles and Percentiles - Measures of Central Tendency, Business Mathematics & Statistics for SSC CGL Preparation
Quartiles and Percentiles - Measures of Central Tendency, Business Mathematics & Statistics Free PDF Download
The Quartiles and Percentiles - Measures of Central Tendency, Business Mathematics & Statistics is an invaluable resource that delves deep into the core of the SSC CGL exam.
These study notes are curated by experts and cover all the essential topics and concepts, making your preparation more efficient and effective.
With the help of these notes, you can grasp complex subjects quickly, revise important points easily,
and reinforce your understanding of key concepts. The study notes are presented in a concise and easy-to-understand manner,
allowing you to optimize your learning process. Whether you're looking for best-recommended books, sample papers, study material,
or toppers' notes, this PDF has got you covered. Download the Quartiles and Percentiles - Measures of Central Tendency, Business Mathematics & Statistics now and kickstart your journey towards success in the SSC CGL exam.
Importance of Quartiles and Percentiles - Measures of Central Tendency, Business Mathematics & Statistics
The importance of Quartiles and Percentiles - Measures of Central Tendency, Business Mathematics & Statistics cannot be overstated, especially for SSC CGL aspirants.
This document holds the key to success in the SSC CGL exam.
It offers a detailed understanding of the concept, providing invaluable insights into the topic.
By knowing the concepts well in advance, students can plan their preparation effectively.
Utilize this indispensable guide for a well-rounded preparation and achieve your desired results.
Quartiles and Percentiles - Measures of Central Tendency, Business Mathematics & Statistics Notes
Quartiles and Percentiles - Measures of Central Tendency, Business Mathematics & Statistics Notes offer in-depth insights into the specific topic to help you master it with ease.
This comprehensive document covers all aspects related to Quartiles and Percentiles - Measures of Central Tendency, Business Mathematics & Statistics.
It includes detailed information about the exam syllabus, recommended books, and study materials for a well-rounded preparation.
Practice papers and question papers enable you to assess your progress effectively.
Additionally, the paper analysis provides valuable tips for tackling the exam strategically.
Access to Toppers' notes gives you an edge in understanding complex concepts.
Whether you're a beginner or aiming for advanced proficiency, Quartiles and Percentiles - Measures of Central Tendency, Business Mathematics & Statistics Notes on EduRev are your ultimate resource for success.
Quartiles and Percentiles - Measures of Central Tendency, Business Mathematics & Statistics SSC CGL Questions
The "Quartiles and Percentiles - Measures of Central Tendency, Business Mathematics & Statistics SSC CGL Questions" guide is a valuable resource for all aspiring students preparing for the
SSC CGL exam. It focuses on providing a wide range of practice questions to help students gauge
their understanding of the exam topics. These questions cover the entire syllabus, ensuring comprehensive preparation.
The guide includes previous years' question papers for students to familiarize themselves with the exam's format and difficulty level.
Additionally, it offers subject-specific question banks, allowing students to focus on weak areas and improve their performance.
Study Quartiles and Percentiles - Measures of Central Tendency, Business Mathematics & Statistics on the App
Students of SSC CGL can study Quartiles and Percentiles - Measures of Central Tendency, Business Mathematics & Statistics alongwith tests & analysis from the EduRev app,
which will help them while preparing for their exam. Apart from the Quartiles and Percentiles - Measures of Central Tendency, Business Mathematics & Statistics,
students can also utilize the EduRev App for other study materials such as previous year question papers, syllabus, important questions, etc.
The EduRev App will make your learning easier as you can access it from anywhere you want.
The content of Quartiles and Percentiles - Measures of Central Tendency, Business Mathematics & Statistics is prepared as per the latest SSC CGL syllabus.
|
© EduRev
|
Education Revolution
|


|


Signup to see your scores
go up within 7 days!
Access 1000+ FREE Docs, Videos and Tests
Takes less than 10 seconds to signup