Karl Pearson's Coefficient of Correlation-Correlation & Regression, Business Mathematics & Statistic | SSC CGL Tier 2 - Study Material, Online Tests, Previous Year PDF Download
Karl Pearson’s Coefficient of Correlation
The measure of degree of relationship between two variables is called the correlation coefficient. It is denoted by symbol r. The assumptions that constitute a bivariate linear correlation population model, for which correlation is to be calculated, includes the following-(ya-lun chou)
1. Both X and Y are random variables. Either variable can be designated as the independent variable, and the other variable is the dependent variable.
2. The bivariate population is normal. A bivariate normal population is, among other things, one in which both X and Y are normally distributed.
3. The relationship between X and Y is, in a sense, linear. This assumption implies that all the means of Y’s associated with X values, fall on a straight line, which is the regression line of Y on X. And all the means of X’s associated with Y values, fall on a straight line, which is the regression line of X on Y. Furthermore, the population regression lines in the two equations are the same if and only if the relationship between Y and X is perfect- that is r = ± 1. Otherwise, with Y dependent, intercepts and slopes will differ from the regression equation with X dependent.
This method is most widely used in practice. It is denoted by symbol V. The formula for computing coefficient of correlation can take various alternative forms depending upon the choice of the user.
METHOD I — WHEN DEVIATIONS ARE TAKEN FROM ACTUAL ARITHMETIC MEAN
(A) WHEN STANDARD DEVIATIONS ARE GIVEN IN THE QUESTION.
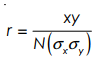
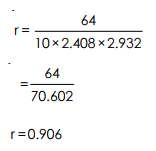
Where x = Deviations taken from actual mean of X series Y = Deviations taken from actual mean of Y series N = Number of items σx = Standard deviation of X series σy = Standard deviation of Y series
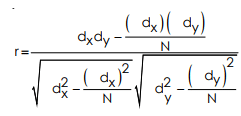
(B) WHEN STANDARD DEVIATIONS ARE NOT GIVEN IN THE QUESTION
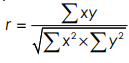
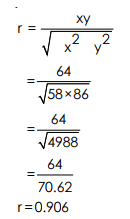
Where Σxy = Sum of product of deviations of X and Y series from actual mean
Σx2 = Sum of squares of deviation of X series from its mean
Σy2 = Sum of squares of deviation of Y series from its mean
Example: 1
Find correlation between marks obtained by 10 students in mathematics and statistics

Solution:
Calculation of coefficient of correlation
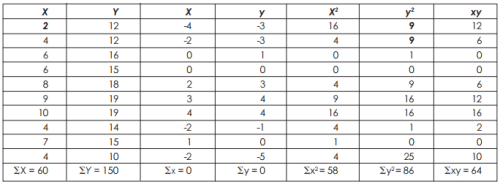
Calculation by Method 1(a)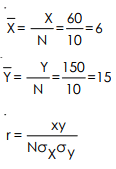
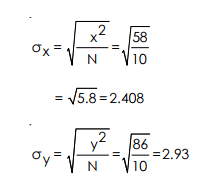
(Note : The above method should be used when specifically asked for, or if standard deviations are already given in the question, otherwise the following method should be used as it is less cumbersome)
Calculation by Method 1(b)
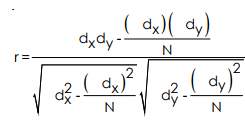
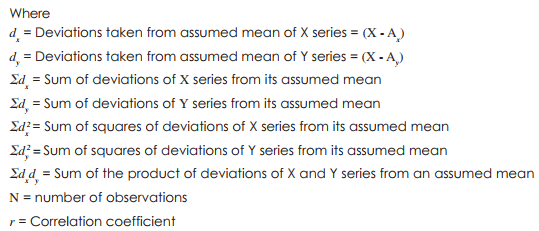
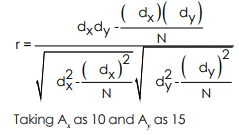
METHOD II WHEN DEVIATIONS ARE TAKEN FROM ASSUMED MEAN
This method is generally used when actual mean of X series or of Y series or both are in decimals, in which case using method I becomes tedious; in such a case deviations are taken from assumed mean to simplify the calculations.
Example 2 :
Calculate coefficient of correlation from following data

Solution :
Since mean of X and Y are in decimals i.e. 11.5 and 12.1 respectively hence we would solve by method II
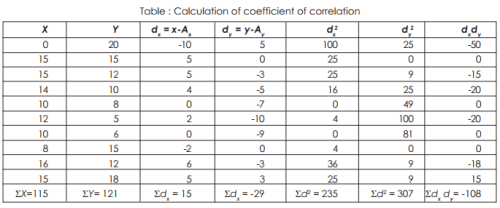
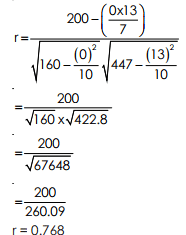
Example 3 : Find correlation between age of husband and age of wife.

Solution :
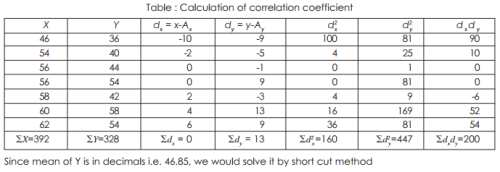
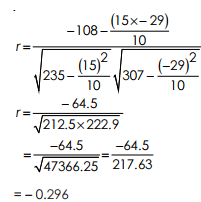
Taking Ax as 10 and Ay as 15 N = 7
Properties of Coefficient of Correlation
- The value of the coefficient of correlation (r) always lies between ±1. Such as:
- r=+1, perfect positive correlation
- r=-1, perfect negative correlation
- r=0, no correlation
- The coefficient of correlation is independent of the origin and scale. By origin, it means subtracting any non-zero constant from the given value of X and Y the vale of “r” remains unchanged. By scale it means, there is no effect on the value of “r” if the value of X and Y is divided or multiplied by any constant.
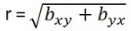
- The coefficient of correlation is a geometric mean of two regression coefficient. Symbolically it is represented as:

- The coefficient of correlation is “ zero” when the variables X and Y are independent. But, however, the converse is not true.
Assumptions of Karl Pearson’s Coefficient of Correlation
- The relationship between the variables is “Linear”, which means when the two variables are plotted, a straight line is formed by the points plotted.
- There are a large number of independent causes that affect the variables under study so as to form a Normal Distribution. Such as, variables like price, demand, supply, etc. are affected by such factors that the normal distribution is formed.
- The variables are independent of each other.
Note: The coefficient of correlation measures not only the magnitude of correlation but also tells the direction. Such as, r = -0.67, which shows correlation is negative because the sign is “-“ and the magnitude is 0.67.
|
1365 videos|1312 docs|1010 tests
|
FAQs on Karl Pearson's Coefficient of Correlation-Correlation & Regression, Business Mathematics & Statistic - SSC CGL Tier 2 - Study Material, Online Tests, Previous Year
| 1. What is Karl Pearson's coefficient of correlation? |  |
| 2. How is Karl Pearson's coefficient of correlation calculated? | |
| 3. What does a positive coefficient of correlation indicate? | |
| 4. How do you interpret the value of Karl Pearson's coefficient of correlation? | |
| 5. Can Karl Pearson's coefficient of correlation be used to establish causation between variables? | |

|
1.1K Views |

|
4.60/5 Rating |

|
Dec 23, 2024 Last updated |
|
1365 videos|1312 docs|1010 tests
|

|
Explore Courses for SSC CGL exam
|
|
practice quizzes
,Sample Paper
,Important questions
,Business Mathematics & Statistic | SSC CGL Tier 2 - Study Material
,Semester Notes
,Online Tests
,Summary
,Previous Year
,ppt
,Previous Year
,Karl Pearson's Coefficient of Correlation-Correlation & Regression
,Free
,mock tests for examination
,Extra Questions
,Business Mathematics & Statistic | SSC CGL Tier 2 - Study Material
,Viva Questions
,Business Mathematics & Statistic | SSC CGL Tier 2 - Study Material
,Objective type Questions
,Previous Year
,Karl Pearson's Coefficient of Correlation-Correlation & Regression
,MCQs
,Previous Year Questions with Solutions
,study material
,Online Tests
,Karl Pearson's Coefficient of Correlation-Correlation & Regression
,Online Tests
,shortcuts and tricks
,past year papers
,video lectures
,Exam
;


Karl Pearson's Coefficient of Correlation-Correlation & Regression, Business Mathematics & Statistic Free PDF Download
Importance of Karl Pearson's Coefficient of Correlation-Correlation & Regression, Business Mathematics & Statistic
Karl Pearson's Coefficient of Correlation-Correlation & Regression, Business Mathematics & Statistic Notes
Karl Pearson's Coefficient of Correlation-Correlation & Regression, Business Mathematics & Statistic SSC CGL Questions
Study Karl Pearson's Coefficient of Correlation-Correlation & Regression, Business Mathematics & Statistic on the App
|
© EduRev
|
Education Revolution
|


|


