Vertical Analysis - Ratio Analysis, Financial Analysis and Reporting | Financial Analysis and Reporting - B Com PDF Download

Vertical analysis (also known as common-size analysis) is a popular method of financial statement analysis that shows each item on a statement as a percentage of a base figure within the statement.
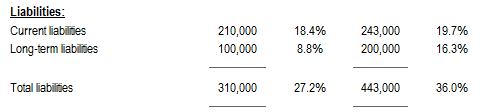
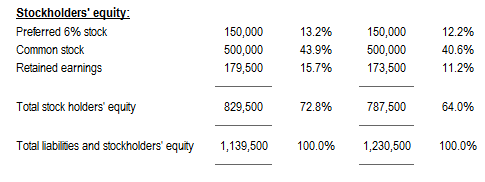
To conduct a vertical analysis of balance sheet, the total of assets and the total of liabilities and stockholders’ equity are generally used as base figures. All individual assets (or groups of assets if condensed form balance sheet is used) are shown as a percentage of total assets. The current liabilities, long term debts and equities are shown as a percentage of the total liabilities and stockholders’ equity.
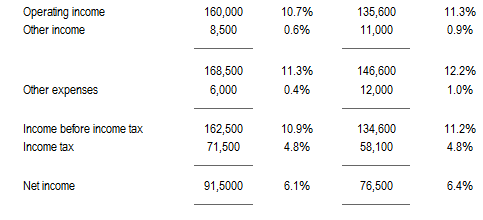
To conduct a vertical analysis of income statement, sales figure is generally used as the base and all other components of income statement like cost of sales, gross profit, operating expenses, income tax, and net income etc. are shown as a percentage of sales.
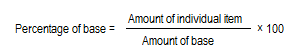
In a vertical analysis the percentage is computed by using the following formula:
A basic vertical analysis needs an individual statement for a reporting period but comparative statements may be prepared to increase the usefulness of the analysis.
Example:
An example of the vertical analysis of balance sheet and income statement is given below:
Comparative balance sheet with vertical analysis:
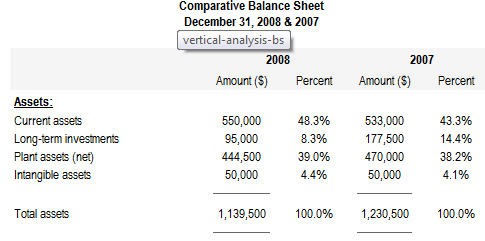
Current assets:
2008: (550,000 / 1,139,500) * 100 = 48.3%
2007: (530,000 / 1,230,500) * 100 = 43.3%
Comparative income statement with vertical analysis:
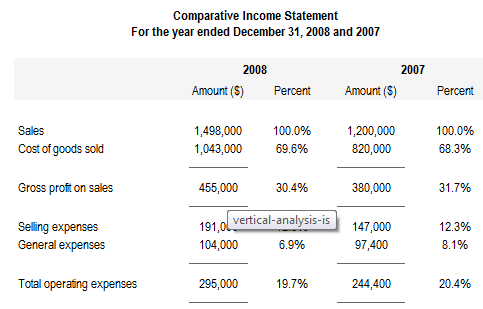
Cost of goods sold:
2008: (1,043,000/1,498,000) × 100 = 69.6%
2007: (820,000/1200,000) × 100 = 68.3%
Vertical analysis states financial statements in a comparable common-size format (percentage form). One of the advantages of common-size analysis is that it can be used for inter-company comparison of enterprises with different sizes because all items are expressed as a percentage of some common number. For example, suppose company A and company B belong to same industry. A is a small company and B is a large company. Company A’s sales and gross profit are $100,000 and $30,000 respectively whereas company B’s sales and gross profit are $1,000,000 and $300,000 respectively. If vertical analysis is conducted and sales figure is used as base, it would show a gross profit percentage of 30% for both the companies as shown below:
Company A and B
Comparative Income Statement
For the year ended
|
Company A |
Company B |
|||
|
Sales |
100,000 |
100% |
1,000,000 |
100% |
|
Cost of goods sold |
70,000 |
70% |
700,000 |
70% |
|
|
——— |
|
———– |
|
|
|
30,000 |
30% |
300,000 |
30% |
|
|
——— |
|
———– |
|
|
2 videos|73 docs|19 tests
|
FAQs on Vertical Analysis - Ratio Analysis, Financial Analysis and Reporting - Financial Analysis and Reporting - B Com
| 1. What is vertical analysis in financial analysis and reporting? |  |
| 2. How is ratio analysis used in financial analysis and reporting? | |
| 3. Why is financial analysis and reporting important for businesses? | |
| 4. What are the key components of financial analysis and reporting? | |
| 5. How can financial analysis and reporting help in decision-making processes? | |


Exam
,study material
,Vertical Analysis - Ratio Analysis
,Summary
,Semester Notes
,Objective type Questions
,Previous Year Questions with Solutions
,Viva Questions
,Financial Analysis and Reporting | Financial Analysis and Reporting - B Com
,Sample Paper
,MCQs
,Extra Questions
,Vertical Analysis - Ratio Analysis
,Financial Analysis and Reporting | Financial Analysis and Reporting - B Com
,video lectures
,shortcuts and tricks
,Financial Analysis and Reporting | Financial Analysis and Reporting - B Com
,Free
,Important questions
,practice quizzes
,ppt
,mock tests for examination
,past year papers
,Vertical Analysis - Ratio Analysis
,


Vertical Analysis - Ratio Analysis, Financial Analysis and Reporting Free PDF Download
Importance of Vertical Analysis - Ratio Analysis, Financial Analysis and Reporting
Vertical Analysis - Ratio Analysis, Financial Analysis and Reporting Notes
Vertical Analysis - Ratio Analysis, Financial Analysis and Reporting B Com Questions
Study Vertical Analysis - Ratio Analysis, Financial Analysis and Reporting on the App
|
© EduRev
|
Education Revolution
|


|


