Economic Ordering Quantity & ABC Analysis - Material Cost, Cost Accounting | Cost Accounting - B Com PDF Download
Economic Ordering Quantity
Economic order quantity refers to that number (quantity) ordered in a single purchase so that the accumulated costs of ordering and carrying costs are at the minimum level. In other words, the quantity that is ordered at one time should be so, which will minimize the total of
(i) Cost of placing orders and receiving the goods, and
(ii) cost of storing the goods as well as interest on the capital invested.
The economic order quantity can be determined by the following simple formula:
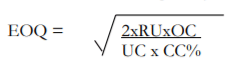
Where;
EOQ = Economic Order Quantity.
RU = Annually Required Units.
OC = Ordering Costs for one order.
UC = Inventory Unit Cost.
CC = Carrying Cost as %age of Unit Cost.
This formula is based on three assumptions:
- Price will remain constant throughout the year and quantity discount is not involved.
- Pattern of consumption, variable ordering costs per order and variable inventory carrying charge per unit per annum will remain the same throughout, and
- EOQ will be delivered each time the stock balance is just reduced to nil.
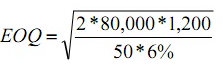
The Economic Order Quantity can be determined by applying the formula as under:
Suppose; the
Annual consumption is 80,000 units,
Cost to place one order is Rs. 1,200
Cost per unit is Rs. 50
Carrying cost is 6% of Unit cost


EOQ = 8,000
As stated above this formula holds good if changes in price are not likely in the near future and consumption is regular. Otherwise, placing orders according to this formula may become expensive.
Carrying cost of inventory consists of
(i) the costs of physical storage such as cost of space, handling and upkeep expenses, insurance, cost of obsolescence, etc., and
(ii) interest on capital invested (the opportunity cost of the capital blocked up). All these costs are expressed in %age of the cost per unit.
Table of EOQ
Economic order quantity can also be proved through a table, by calculating total cost at different order quantities.
Following is a table that is showing total cost at five different order quantities, assuming that the annual requirement of the units to be consumed remains the same. Here the total cost comprises of ordering cost and carrying cost.
Total Ordering cost
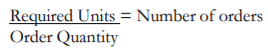
Ordering cost is arrived by multiplying the number of orders in a year with the cost per order. Number of order is calculated by dividing annually required units by the order quantity.
Step I:
Step II: Number of orders x Cost per order
Total Carrying Cost
Carrying cost is arrived by multiplying the average ordering quantity with the carrying cost per unit. Average ordering quantity is calculated by dividing the ordering quantity by 2. (It is assumed that half of the ordering quantity is always kept into the store, this is the reason the ordering quantity is divided by 2)

Step II: Carrying cost per unit = Unit Cost * CC %age
Step III: Average ordering quantity x Carrying cost per unit
Applying these steps at different presumed order quantities (inclusive of the Economic Order Quantity) we can develop a table.
Order Quantity | Required Units | Number of orders | Total Ordering Cost Number of orders x Rs. 1,200 | Total Carrying Cost Avg Order qty x Rs.3 | Total cost |
20,000 | 80,000 | 4 | 4,800 | 30,000 | 34,800 |
10,000 | 80,000 | 8 | 9,600 | 15,000 | 24,600 |
8,000 | 80,000 | 10 | 12,000 | 12,000 | 24,000 |
5,000 | 80,000 | 16 | 19,200 | 7,500 | 26,700 |
4,000 | 80,000 | 20 | 24,000 | 6,000 | 30,000 |
The above table shows that 8,000 is the economic order quantity because at this point total cost is the minimum. At this point total ordering cost is equal to the total carrying cost. If the order quantity is increased it will although result in reducing the total ordering cost but at the same time more carrying cost will be incurred to store the inventory. Whereas if the order quantity is decreased it will although result in reducing the total carrying cost but at the same time more ordering cost will be incurred as the number of orders will increase.
EOQ Graph
Economic order quantity can also be determined through a graph. Here the above information is plotted in a graph for total ordering cost, total carrying cost and total cost at different ordering quantities. The point at which the line of total ordering cost intersects with the total carrying cost is the EOQ. At this point the line of total cost will give a bend that shows the minimum cost.
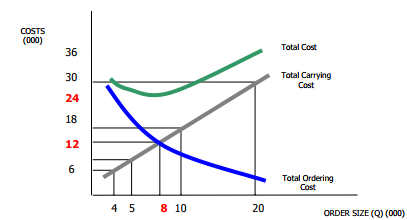
In the above graph line of total carrying cost intersects line of total ordering cost at 8,000 order quantities, where both of the costs are Rs. 12,000. At this order quantity the total cost is Rs. 24,000 which is the minimum most. If the order quantity is increased or decreased the total cost will be more than the cost at EOQ. This is also evident from the above graph.
Example of How to Use EOQ
EOQ takes into account the timing of reordering, the cost incurred to place an order, and the cost to store merchandise. If a company is constantly placing small orders to maintain a specific inventory level, the ordering costs are higher, and there is a need for additional storage space.
Assume, for example, a retail clothing shop carries a line of men’s jeans, and the shop sells 1,000 pairs of jeans each year. It costs the company $5 per year to hold a pair of jeans in inventory, and the fixed cost to place an order is $2.
The EOQ formula is the square root of (2 x 1,000 pairs x $2 order cost) / ($5 holding cost) or 28.3 with rounding. The ideal order size to minimize costs and meet customer demand is slightly more than 28 pairs of jeans. A more complex portion of the EOQ formula provides the reorder point.
Limitations of Using EOQ
The EOQ formula assumes that consumer demand is constant. The calculation also assumes that both ordering and holding costs remain constant. This fact makes it difficult or impossible for the formula to account for business events such as changing consumer demand, seasonal changes in inventory costs, lost sales revenue due to inventory shortages, or purchase discounts a company might realize for buying inventory in larger quantities.
Example 1:
Demand for the Child Cycle at Best Buy is 500 units per month. Best Buy incurs a fixed order placement, transportation, and receiving cost of Rs. 4,000 each time an order is placed. Each cycle costs Rs. 500 and the retailer has a holding cost of 20 percent. Evaluate the number of computers that the store manager should order in each replenishment lot?
Solution.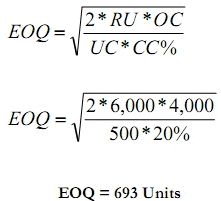
Example 2:
ABC Ltd. uses EOQ logic to determine the order quantity for its various components and is planning its orders. The Annual consumption is 80,000 units, Cost to place one order is Rs. 1,200, Cost per unit is Rs. 50 and carrying cost is 6% of Unit cost. Find EOQ, No. of order per year, Ordering Cost and Carrying Cost and Total Cost of Inventory.
Solution.
1. Economic Qrder Quantity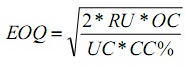
EOQ = 8000 Units
2. Number of Order Per Year
No of order per year = Annual Requirements / EOQ
No of order per year = 80000 / 8,000
No of order per year = 10 Order per year
3. Ordering Cost
Ordering Cost = Fired ordering cost (F) * Number of Order per year N
Ordering Cost = 1,200 * 10
Ordering Cost = 12,000 Rupees
4. Carrying Cost
Carrying Cost = Carrying Cost (C) * EOQ/2
Carrying Cost =50*0.06* 8,000/2
Carrying Cost =12,000 Rupees
5. Total Inventory Cost
Total Inventory Cost = Ordering cost + Carrying Cost
Total Inventory Cost = 12,000 + 12,000
Total Inventory Cost = 24,000 Rupees
Example 3:
Midwest Precision Control Corporation is trying to decide between two alternate Order Plans for its inventory of a certain item. Irrespective of the plan to be followed, demand for the item is expected to be 1,000 units annually. Under Plan 1st, Midwest would use a teletype for ordering; order costs would be Rs. 40 per order. Inventory holding costs (carrying cost) would be Rs. 100 per unit per annum. Under Plan 2nd order costs would be Rs. 30 per order. And holding costs would 20% and unit Cost is Rs. 480. Find out EOQ and Total Inventory Cost than decide which Plan would result in the lowest total inventory cost?
Solution.
Plan 1st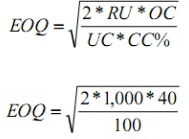
EOQ = 28
Total Inventory Cost = [Fixed ordering cost (F) * Number of Order per year N] + [Carrying Cost (C) * EOQ/2]
Total Inventory Cost = [40 * 1,000/28] + [100* 28/2]
Total Inventory Cost = 1,440 + 1,400
Total Inventory Cost =Rs. 2,840
Plan 2nd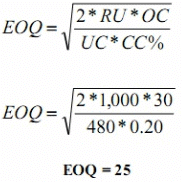
Total Inventory Cost = [Fixed ordering cost (F) * Number of Order per year N] + Carrying Cost (C)* EOQ/2
Total Inventory Cost - [30 * 1,000/25] [480*0.20* 25/2]
Total Inventory Cost = 1,200 + 1,200
Total Inventory Cost = R s. 2,400
Plan 2nd is best
Example 4:
A local TV repairs shop uses 36,000 units of a part each year (A maximum consumption of 100 units per working day). It costs Rs. 20 to place and receive an order. The shop orders in lots of 400 units. It cost Rs. 4 to carry one unit per year of inventory.
Requirements:
(1) Calculate total annual ordering cost
(2) Calculate total annual carrying cost
(3) Calculate total annual inventory cost
(4) Calculate the Economic Order Quantity
(5) Calculate the total annual cost inventory cost using EOQ inventory Policy
(6) How much save using EOQ
(7) Compute ordering point assuming the lead time is 3 days
Solution: (1) Calculate total annual ordering cost
Ordering Cost = Fixed ordering cost (F) * Number of Order per year N
Ordering Cost = 20 * 36,000/400
Ordering Cost = Rs. 1,800
Solution: (2) Calculate total annual carrying cost
Carrying Cost = Carrying Cost (C) * EOQ/2
Carrying Cost = 4* 400/2
Carrying Cost = Rs. 800
Solution: (3) Calculate total annual inventory cost
Total Inventory Cost = Ordering cost + Carrying Cost
Total Inventory Cost = 1,800 + 800
Total Inventory Cost = Rs. 2,600
Solution: (4) Calculate the Economic Order Quantity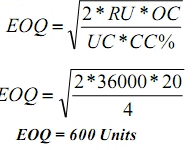
Solution: (5) Calculate the total annual cost inventory cost using EOQ inventory Policy
Total Inventory Cost = [Fixed ordering cost (F) * Number of Order per year N] + Carrying Cost (C) * EOQ/2
Total Inventory Cost = [20 * 36,000/600] + [4 * 600/2]
Total Inventory Cost = 1,200 + 1,200
Total Inventory Cost =Rs. 2,400
Solution: (6) How much save using EOQ
How much save using EOQ = 2,600 -2,400 = Rs. 200
Solution: (7) Compute ordering point assuming the lead time is 3 days
Re-order level = Maximum consumption * Lead Time [maximum]
100 * 3 = 300 per day
ABC Analysis
Under ABC Analysis, the materials in stock are divided into three categories for the purpose of control. Generally it is seen that the materials which constitute the least percentage of items in stock may contribute to a large percentage of value and a large percentage of items may represent a smaller percentage of value of items consumed. Between these two items are those items, the percentage of which is more or less equal to their value in consumption. Items falling in the first category are treated as ‘A’ items, of the second category as ‘B’ items and items of the third category are taken as ‘C’ items. Such an analysis of material is known as ABC analysis. This technique of stock control is also known as stock control according to value method or Always Better Control method or Proportional Parts Value Analysis method. Thus, under this technique of material control, materials are listed in ‘A’, ‘B’ and ‘C’ categories in descending order based on money value of consumption.
ABC analysis measures the cost significance of each item of material. It concentrates on important items, so it is also known as ‘Control by Importance and Exception” (CIE).
The report of the Indian Productivity Team on “Stores and Inventory Control in U.S.A., Japan and West Germany” gives the following example of ABC Analysis:
Group | Percentage of Items | Percentage of Costs |
A | 8% | 75% |
B | 25% | 20% |
C | 67% | 5% |
The significance of this analysis is that a very close control is exercised over the items of ‘A’ group which account for a high percentage of costs while less stringent control is adequate for category ‘B’ and very little control would suffice for category ’C’ items.
Meaning of ABC Analysis:
For selective inventory control, three classes of materials and not more than that have been found to be convenient. This is known in general as the ABC Classification. The alphabets A, B & C stand for the three different classes and it is popularly known as Always Better Control.
ABC analysis is a basic analytical management tool. The greatest effort for the greatest results is ultimate yield of such analysis of materials. There are areas in material management which need selective control such as inventory, criticality of items, obsolete stocks, purchasing order, receipt of materials, inspection, store-keeping and verification of bills.
The annual consumption analysis on the basis of money value indicates that about 10 percent of the high value items account for a substantial portion of about 75 percent of the total consumption value. There are vital “A” basis; 70 percent of the total number of items are trivial ; there are bottom items accounting for 10 percent of the consumption value, and termed as “C” items. In between ‘A’ and ‘C’ items—between top and bottom—the items are known as ‘B’ category items.
When items are, numerous, to give attention to all the items is next i to impossible. The pointed and concentrated attention focused on the materials according to their relative importance, pays large dividend to the organization as a whole by securing economies and efficiency.
It is through ABC analysis, some authorities believe, that clerical costs are reduced. ABC analysis helps better planning and improved inventory turnover is assured. Preferential treatment to vital items through concentrated alienation under the ABC system of analysis of inventory is the panacea for the cure of a number of ills plaguing an organisation.
Objectives of ABC Analysis:
The ultimate objective of ABC analysis is to secure economy through efficient materials management. It has also the object of developing policy guide lines for selective control. Confronted with a huge number of items when the material management is baffled to which to give attention, the ABC analysis helps the managements to discriminate items and concentrate on the most important items first, then on the second grade items and then on the rest — the third grade.
This graded attention to the graded material is not only scientific but also very much pragmatic for its due weightage to materials on the basis of their consumption value. The rigorous procedure in regard to ‘A’ items ensures better “materials planning, forecasts, ordering, review, record, postings, revisions, lead time analysis, safety stock, material consumption control, purchase budget, delivery schedule, value analysis follow-up, efforts, physical stock verifications, receipt issue, stores accounting and inspection — G. krisnan & Sundareshan.” The objective of securing overall efficiency in materials management is then assured through ABC analysis.
Limitations of ABC Analysis:
ABC analysis suffers from certain limitations. It is not fully effective without standardisation and codification. ABC analysis is based on gradation, programme of the material being the main criterion, that is by V.E.D — Vital, Essential and Desirable.
Even some items with less monetary value may be vital for the plant and may need special attention. If the inventory position is analysed according to the value I.e., XYZ analysis, the result of ABC and ABC analyses will be different depending upon the nature of obsolete items. The ABC analysis needs periodical review and updating.
Some very common may become vital as we find in case of diesel oil during power crisis. The limitations in a system are quite likely to exist; but what is needed is to overcome them after being guarded against any pitfall.
Example of ABC Analysis
Lisa has a business of sweaters, and over time, her business has achieved tremendous success. Lisa, in search for varieties and additions to her sweater inventory, has filled in 180 types of sweaters instead of just 50 types. She now realizes that this business is seasonal and she already has invested a lot. After thorough research on how the above-mentioned problem can be streamlined, Lisa implemented the ABC inventory categorization in her business model.
She was finally able to allow her business to visualize those areas wherein more profit was expected.
Now, as Lisa already had too many options to organize into three categories: Category A, B, and C, depending on their selling ratio, price, demand, etc.
Category A – The sweaters that fall under this category are the ones that are most important to the company. They can either be the ones that are highly in demand, the ones that are generating the most revenue, or the ones falling under the hottest trend for the season.
Category B – These sweaters are important to the company, but not as much as the ones in category A. A smaller market or lesser comparative demand are some of the reasons. For example, Christmas sweaters are mostly sold during the season and not very much before or after that. But yes, during the seasons, the sales do go up. Lisa can neither neglect such sweaters nor can she make much profit when not in season. Hence, category B.
Category C – This category includes the products that are neither in category A nor in category B. Lisa doesn’t wish to put in more efforts to sell off these sweaters as they are not of high value to the company. Odd sizing, color combinations, patterns can be the possible reasons for Lisa to put these sweaters in category C.
|
106 videos|173 docs|18 tests
|
FAQs on Economic Ordering Quantity & ABC Analysis - Material Cost, Cost Accounting - Cost Accounting - B Com
| 1. What is Economic Ordering Quantity (EOQ)? |  |
| 2. How is EOQ calculated? | |
| 3. What is ABC Analysis in cost accounting? | |
| 4. How is ABC Analysis performed? | |
| 5. What are the benefits of using EOQ and ABC Analysis in cost management? | |

|
2.8K Views |

|
4.63/5 Rating |

|
Dec 23, 2024 Last updated |

|
Explore Courses for B Com exam
|
|
Economic Ordering Quantity & ABC Analysis - Material Cost
,Cost Accounting | Cost Accounting - B Com
,Cost Accounting | Cost Accounting - B Com
,Sample Paper
,Exam
,Previous Year Questions with Solutions
,video lectures
,Important questions
,Semester Notes
,practice quizzes
,Cost Accounting | Cost Accounting - B Com
,mock tests for examination
,MCQs
,shortcuts and tricks
,Summary
,Economic Ordering Quantity & ABC Analysis - Material Cost
,Objective type Questions
,Free
,Economic Ordering Quantity & ABC Analysis - Material Cost
,Extra Questions
,study material
,ppt
,past year papers
,Viva Questions
;


Economic Ordering Quantity & ABC Analysis - Material Cost, Cost Accounting Free PDF Download
Importance of Economic Ordering Quantity & ABC Analysis - Material Cost, Cost Accounting
Economic Ordering Quantity & ABC Analysis - Material Cost, Cost Accounting Notes
Economic Ordering Quantity & ABC Analysis - Material Cost, Cost Accounting B Com Questions
Study Economic Ordering Quantity & ABC Analysis - Material Cost, Cost Accounting on the App
|
© EduRev
|
Education Revolution
|


|


