Break even Analysis - Cost Accounting Techniques, Cost Accounting | Cost Accounting - B Com PDF Download
BREAK-EVEN ANALYSIS/COST-VOLUME PROFIT ANALYSIS
A fundamental of accounting is that all revenues and costs must be accounted for and the difference between the revenues and costs is the profit, or loss, of the business. Costs can be classified as either a fixed cost or a variable cost.
A fixed cost is one that is independent of the level of sales; rather, it is related to the
passage of time. Examples of fixed costs include rent, salaries and insurance.
A variable cost is one that is directly related to the level of sales, such as cost of goods
sold and commissions.
This categorisation of costs into “variable” and “fixed” elements and their relationship with sales and profits has been developed as “break-even analysis”. This break even analysis is also known as Cost–volume– profit (CVP) analysis.
Cost–volume–profit (CVP) analysis is defined in CIMA’s Official Terminology as
‘the study of the effects on future profit of changes in fixed cost, variable cost, sales price, quantity and mix’.
In break even analysis or CVP analysis an activity level is determined at which all relevant cost are recovered and there is a situation of no profit or no loss. This activity level is called breakeven point.
The break-even point in any business is that point at which the volume of sales or revenues exactly equals total expenses or the point at which there is neither a profit nor loss under varying levels of activity. The break-even point tells the manager what level of output or activity is required before the firm can make a profit; reflects the relationship between costs, volume and profits. In another words breakeven point is the level of sales or production at which the total costs and total revenue of a business are equal.
At Break-even point or level, the sales revenues are just equal to the costs incurred. Below Breakeven point level the firm will make losses, while above this level it will be making profits. This is so because that while the variable costs vary according to the variations in the volume or level of activity while the fixed costs do not change.
Below the breakeven point, fixed costs will eat up all excess of sales over variable cost and yet be unsatisfied, leaving a loss. Above the BEP, excess of sales over variable costs (this excess is known as contribution) is much more than the fixed costs of the activities and, it, thus leads to profits. Thus in Break Even analysis or Cost Volume Profit Analysis, it is possible to analyse the effect of changes in volume, prices and variable costs on the profits of an organization, while taking fixed costs as unchangeable.
The cost-volume-profit (CVP) analysis helps management in finding out the relationship of costs and revenues to profit. The aim of an undertaking is to earn profit. Profit depends upon a large number of factors, the most important of which are the cost of manufacture and the volume of sales effected. Both these factors are interdependent-volume of sales depends upon the volume production, which in turn is related to costs. Cost, again, is the resultant of the operation of a number of varying factors. Such factors affecting cost are:
(i) Volume of production;
(ii) Product-mix;
(iii) Internal efficiency;
(iv) Methods of production; and
(v) Size of plant; etc.
Analysis of cost-volume-profit involves consideration of the interplay of the following factors:
(i) Volume of sales;
(ii) Selling price;
(iii) Product mix of sales;
(iv) Variable costs per unit; and
(v) Total fixed costs.
The relationship between two or more of these factors may be (i) present in the form of reports and statements, (ii) shown in charts or graphs, or (iii) established in the form of mathematical deductions.
OBJECTIVES OF BREAK EVEN ANAYSIS/COST-VOLUME-PROFIT ANALYSIS
The objectives of cost-volume profit analysis are given below:
(1) In order to forecast profit accurately, it is essential to know the relationship between profits and costs on the one hand and volume on the other.
(2) Cost-volume-profit analysis is useful in setting up flexible budgets which indicate costs at various levels of activity.
(3) Cost-volume-profit analysis is of assistance in performance evaluation for the purposes of control. For reviewing profits achieved and cost incurred the effects on costs of changes in volume are required to be evaluated.
(4) Pricing plays an important part in stabilizing and fixing up volume. Analysis of cost-volume-profit relationship may assist in formulating price policies to suit particular circumstances by projecting the effect which different price structures have on costs and profits.
(5) As predetermined overhead rates are related to a selected volume of production, study of costvolume relationship is necessary in order to know the amount of overhead costs which could be charged to product costs at various level of operation.
ADVANTAGES OF BREAK-EVEN ANALYSIS
(i) It provides detailed and clearly understandable information. The chart visualises the informationvery clearly and a glance at the chart gives a vivid picture of the whole affairs. The information is presented in a simple form and therefore, is clearly understandable even to a layman.
(ii) The profitability of different products can be known with the help of break-even charts, besides the level of no-profit no-loss. The problem of managerial decision regarding temporary or permanent shutdown of business or continuation at a loss can be solved by break-even analysis.
(iii) The effect of changes in fixed and variable costs at different levels of production or profits can be demonstrated by the graph legibly.
(iv) The break-even chart shows the relative importance of fixed cost in the total cost of a product. If the costs are high, it induces management to take measures to control such costs.
(v) The economies of scale, capacity utilisation, comparative plant efficiencies can be analysed through the break-even chart. The operational efficiency of a plant is indicated by the angle of incidence formed at the intersection of the total cost line and sales line.
(vi) Break-even analysis is very helpful for forecasting, long-term planning, growth and stability.
LIMITATIONS OF BREAK-EVEN ANALYSIS
Though break-even analysis has gradually become service tool for modern financial management, there are certain objections raised against the utility of break-even analysis:
(i) Fixed costs do not always remain constant.
(ii) Variable costs do not always vary proportionately.
(iii) Sales revenue does not always change proportionately.
(iv) The horizontal axis cannot measure the units sold in as much as many unlike type of products aresold by the same enterprise.
(v) Break-even analysis is of doubtful validity when the business is selling many products with different profit margins.
(vi) Break-even analysis is based on the assumption that income is influenced by changes in sales so that changes in inventory would not directly affect income. If marginal costing is used, this assumption would hold good but in other cases, changes in inventory will affect income because the absorption of fixed costs will depend on production rather than sales.
(vii) Condition of growth or expansion in an organisation are not assumed under break-even analysis. In actual life of any business organisation, the operation undergoes a continuous process of growth and expansion.
(viii) Only a limited amount of information can be presented in a single break-even chart. If we have to study the changes of fixed costs, variable costs and selling prices, a number of charts will have to be drawn up.
(ix) Even simple tabulation of the results of costs and sales can serve the purpose which is served by a break-even chart, hence there is no need of presenting the data through a break-even chart.
(x) The chart becomes very complicated and difficult to understand for a layman, if the number of lines or curves depicted on the graph are large.
(xi) The chart does not provide any basis for comparative efficiency between different units or organisations.
USES OF COST-VOLUME-PROFIT ANALYSIS
1. C.V.P. analysis helps in forecasting costs and profits as a result of change in volume.
2. It helps fixing a sales volume level to earn or cover a given revenue, return on capital employed, or rate of dividend.
3. It assists determination of effect of change in volume due to plant expansion or acceptance of an order, with or without increase in costs or in other words a quantum of profit to be obtained can be determined with change in volume of sales.
4. C.V.P. analysis helps in determining relative profitability of each product, line, project or profit plan.
5. Through cost volume-profit analysis inter-firm comparison of profitability can be done intelligently.
6. It helps in determining cash requirements at a desired volume of output, with the help of cash breakeven charts.
7. Break-even analysis emphasises the importance of capacity utilisation for achieving economy.
8. From break-even analysis during severe recession, the comparative effects of a shut down or continued operation at a loss is indicated.
9. The effect on total cost of a change in the fixed over-head is more clearly demonstrated through break-even analysis and cost- volume-profit charts.
10. The conditions of a business such as profit potentialities, requirements of capital, financial stability and incidence of fixed and variable costs can be gauged from a study of the position of the breakeven point and the angle of incidence in the break-even chart.
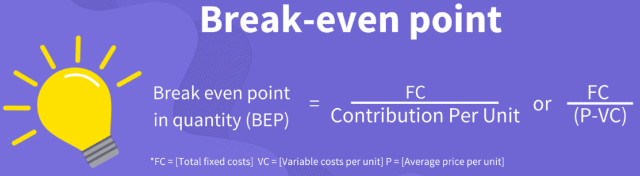
Formula:
For an example:
Variable costs per unit: Rs. 400 Sale price per unit: Rs. 600 Desired profits: Rs. 4,00,000 Total fixed costs: Rs. 10,00,000 First we need to calculate the break-even point per unit, so we will divide the Rs.10,00,000 of fixed costs by the Rs. 200 which is the contribution per unit (Rs. 600 – Rs. 200). Break Even Point = Rs. 10,00,000/ Rs. 200 = 5000 units Next, this number of units can be shown in rupees by multiplying the 5,000 units with the selling price of Rs. 600 per unit. We get Break Even Sales at 5000 units x Rs. 600 = Rs. 30,00,000. (Break-even point in rupees)
Break-Even Analysis: Problem with Solution # 1.
From the following particulars, calculate:
(i) Break-even point in terms of sales value and in units.
(ii) Number of units that must be sold to earn a profit of Rs. 90,000.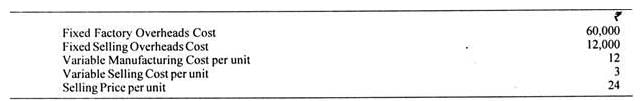
Solution: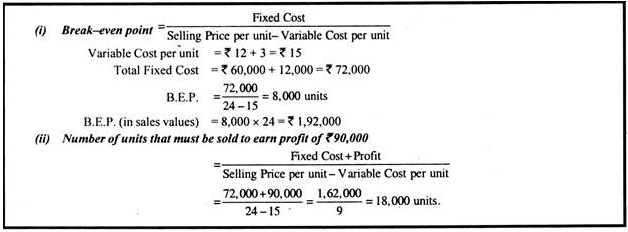
Break-Even Analysis: Problem with Solution # 2.
From the following data, you are required to calculate:
(a) P/V ratio
(b) Break-even sales with the help of P/V ratio.
(c) Sales required to earn a profit of Rs. 4,50,000
Fixed Expenses = Rs. 90,000
Variable Cost per unit:
Direct Material = Rs. 5
Direct Labour = Rs. 2
Direct Overheads = 100% of Direct Labour
Selling Price per unit = Rs. 12.
Solution: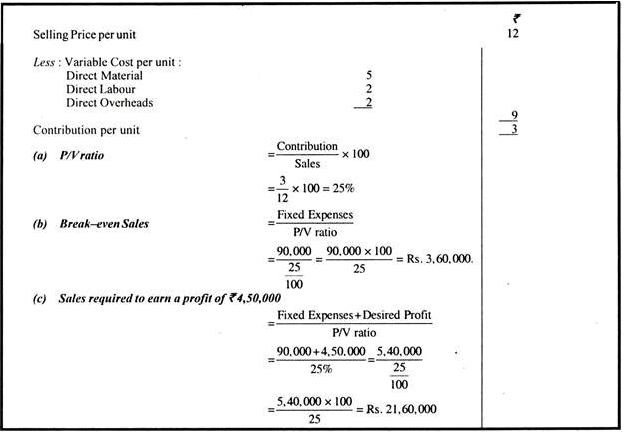
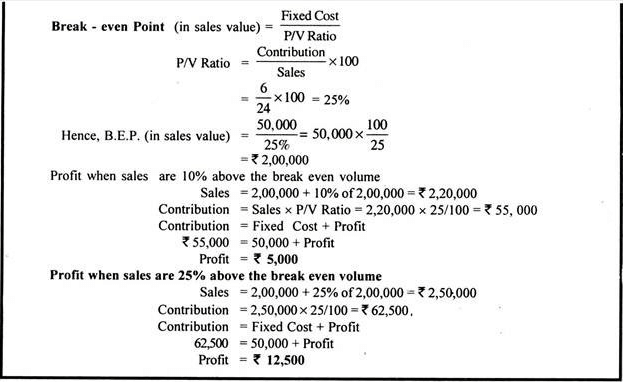
Break-Even Analysis: Problem with Solution # 3.
From the following data, you are required to calculate break-even point and net sales value at this point: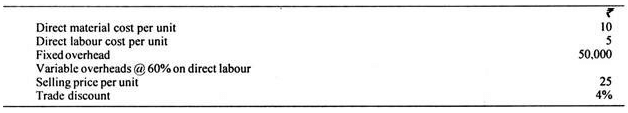
If sales are 10% and 25% above the break even volume, determine the net profits.
Solution: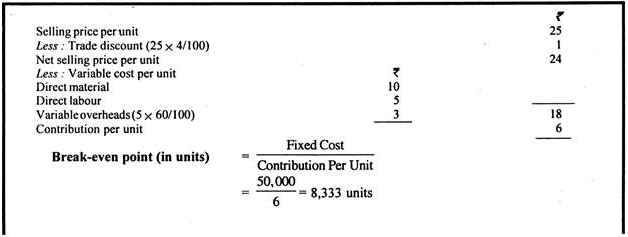
Break-Even Analysis: Problem with Solution # 4.
From the following particulars, find out the break-even-point: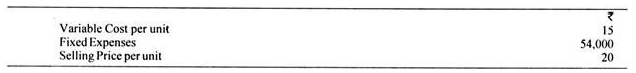
What should be the selling price per unit, if the break-even point should be brought down to 6,000 units?
Solution: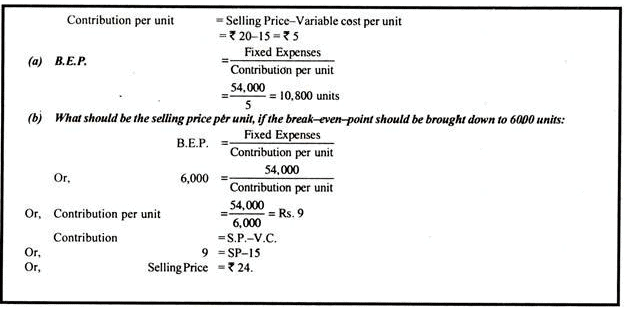
Break-Even Analysis: Problem with Solution # 5.
The fixed costs amount to Rs. 50,000 and the percentage of variable costs to sales is given to be 66 ⅔%.
If 100% capacity sales are Rs. 3,00,000, find out the break-even point and the percentage sales when it occurred. Determine profit at 80% capacity:
Solution: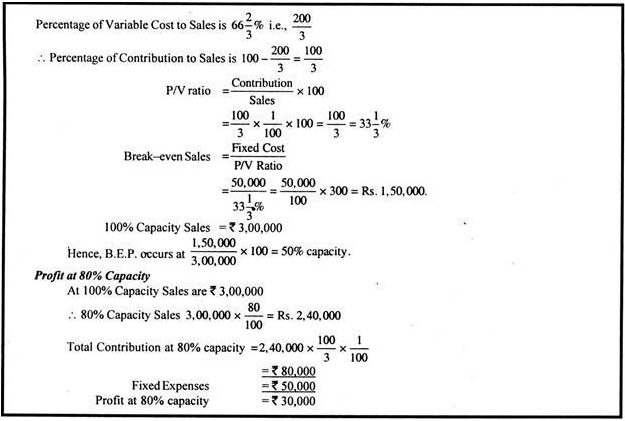
Break-Even Analysis: Problem with Solution # 6.
From the following information, ascertain by how much the value of sales must be increased by the company to break-even: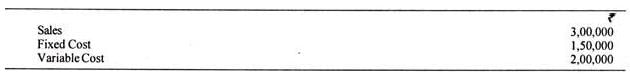
Solution: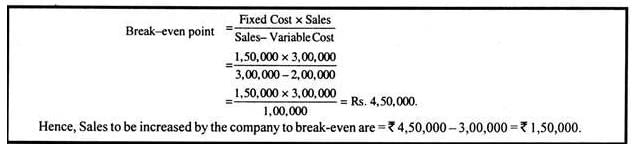
Break-Even Analysis: Problem with Solution # 7.
Calculate:
(i) The amount of fixed expenses.
(ii) The number of units to break-even.
(iii) The number of units to earn a profit of Rs. 40,000.
The selling price per unit can be assumed at Rs. 100.
The company sold in two successive periods 7,000 units and 9,000 units and has incurred a loss of Rs. 10,000 and earned Rs. 10,000 as profit respectively.
Solution: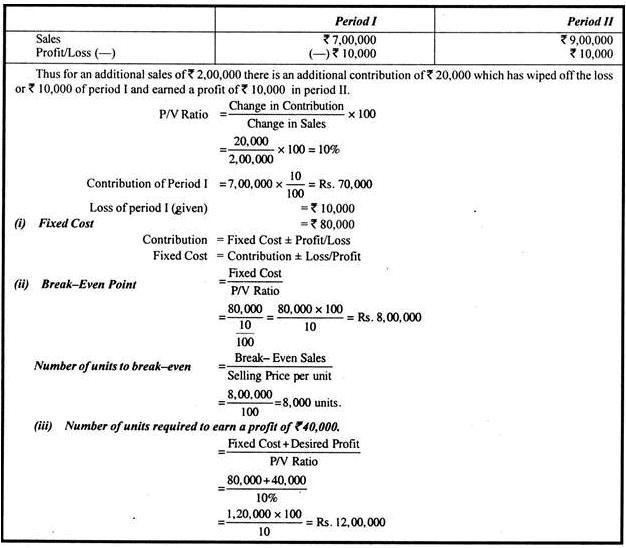
Break-Even Analysis: Problem with Solution # 8.
A company is making a loss of Rs. 40,000 and relevant information is as follows:
Sales Rs. 1,20,000; Variable Costs Rs. 60,000; Fixed costs Rs. 1,00,000.
Loss can be made good either by increasing the sales price or by increasing sales volume. What are Break even sales if
(a) Present sales level is maintained and the selling price is increased.
(b) If present selling price is maintained and the sales volume is increased. What would be sales if a profit of Rs. 1,00,000 is required ?
Solution: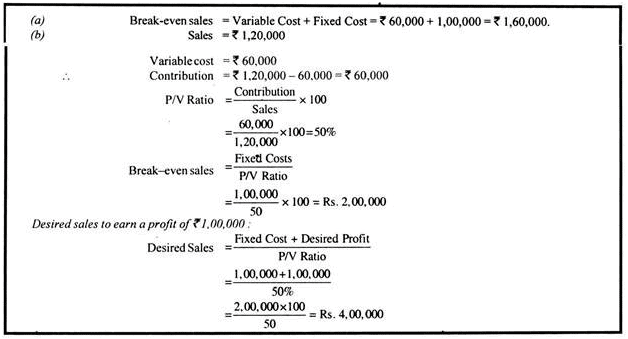
|
106 videos|173 docs|18 tests
|
FAQs on Break even Analysis - Cost Accounting Techniques, Cost Accounting - Cost Accounting - B Com
| 1. What is a break-even analysis and why is it important in cost accounting? |  |
| 2. How is the break-even point calculated in cost accounting? | |
| 3. What are the limitations of break-even analysis in cost accounting? | |
| 4. How can break-even analysis help in determining the selling price of a product? | |
| 5. Can break-even analysis be used to evaluate the profitability of a business? | |

|
4.85/5 Rating |

|
Dec 23, 2024 Last updated |

|
Explore Courses for B Com exam
|
|
Cost Accounting | Cost Accounting - B Com
,Cost Accounting | Cost Accounting - B Com
,Cost Accounting | Cost Accounting - B Com
,past year papers
,Summary
,Break even Analysis - Cost Accounting Techniques
,Viva Questions
,Semester Notes
,Break even Analysis - Cost Accounting Techniques
,Objective type Questions
,Break even Analysis - Cost Accounting Techniques
,Free
,practice quizzes
,ppt
,video lectures
,Sample Paper
,MCQs
,Important questions
,Extra Questions
,mock tests for examination
,Previous Year Questions with Solutions
,study material
,shortcuts and tricks
,Exam
;


Break even Analysis - Cost Accounting Techniques, Cost Accounting Free PDF Download
Importance of Break even Analysis - Cost Accounting Techniques, Cost Accounting
Break even Analysis - Cost Accounting Techniques, Cost Accounting Notes
Break even Analysis - Cost Accounting Techniques, Cost Accounting B Com Questions
Study Break even Analysis - Cost Accounting Techniques, Cost Accounting on the App
|
© EduRev
|
Education Revolution
|


|


