Branding (Part - 3) - Product Planning and Market Strategies, Marketing Management | Marketing Management - B Com PDF Download
A. Cost Based Methods:
1. Historical Cost Method:
This represents the money that has been spent on the brand to date. Say Rs. 150 million have been expended in creating a brand ‘X’ for a particular product. The value at which the brand can be sold to another firm should be Rs. 150 million. It is quite appealing on intuitive grounds.
However, the problems associated with historical cost are:
(1) The prospective buyer is more interested in the future cash flows from a brand and the fact that Rs. 100 million was spent on brand ‘X’ doesn’t guarantee the realisation of even a small chunk of it that amount in future sales.
The costs incurred in brands are no measured of the efficiency with which the money was spent. There are living examples of American and Japanese firms.
The budgets of General Motors, Siemens, Philips, Xerox-and IBM are much higher than Japanese competitors such as Honda, Hitachi, Sony, Canon and National Electrical Company.
The result is that with small budgets Japanese companies have more successful models. Funds may be abundant but badly spent will not yield good result is terms of brand equity. Hence, historical costs are our inadequate measure of a brand’s future potential even when the costs are adjusted to the current prices.
2. Replacement Cost:
In 1997, Colgate had a turnover of Rs. 6,810 million with a gross profit of Rs. 146 crores or 1,460 million rupees, reached 3 lakh retailers directly enjoying top rank so far as consumer awareness ranking by A.M. magazine of 1997 November. This is what the calculation of cost to create the brand with similar indicators such is turnover, profitability distribution reach, brand loyalty and so on.
The marketing experts are of the opinion that to launch a product with national brand will be around 50 million rupees. Add to this the production, distribution and other marketing underfoot costs.
A marketing and simple calculation can demonstrate this figure. Take the arch rival brand of Colgate namely Close-up of H.L.L. In case of Close-up Rs. 2, 000 million was spent cumulatively on production and marketing over the years to achieve its present position.
To this, add amount for brand loyalty and distribution equity it commands. Let us take that HLL has spent another 600 million rupees. Speaking alternatively the brand value of Close up is 2,600 million rupees.
That is replacement cost is:
RC = LC + PO + AO + SDO + BP
Where RC = Replacement Cost
LC = Launch Cost
PO = Production Overheads
AO = Administrator Overheads
SDO = Selling and Distribution Overheads
BD = Brand Premium acquired over the year due of brand Loyalty.
This approach is better than historic cost approach as it considers today’s costs than of past. However, procedurally it is not that simple to calculate as it appears. It is not totally free from the weakness of historic costs.
The question is what guarantee is there of HLL spending 2,600 million to say for acquiring 18 percent market shares in case of Close up did ? That is present costs or replacement costs are as bad indicators as historic or past costs so far as evaluating the brand equity is the focus.
3. Market Value Method:
For a particular brand, brand value is obtained with the value that has been realized in comparable current merger or acquisition. The data available showing past and present position of some six companies taken from Business World October 5-18-1994 which is much relevant here.
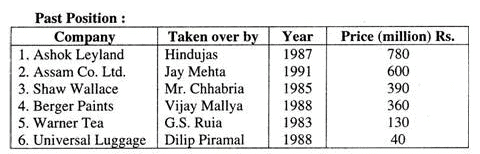
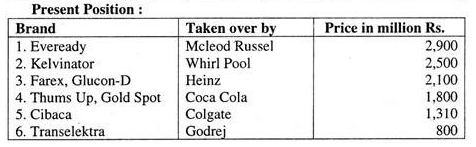
It is evident from the information that Cibaca was taken over by Colgate for Rs. 1310 million. If Cibacas equity as Rs. 1310 million, what is the equity of Colgate? As Colgate has 17 times the turnover of Cibaca, it works out Rs. 22270 million. Instead of taking as STR (Sales Turn Over) one can take even EPS earnings per share as multiplier where EPS = PAT + Number of Equity Shares.
4. Discounted Cash Flow Method:
This method consists of two elements namely:
(1) Estimating the cash-flows that will accrue in future and
(2) Conversion these cash flows to present value discounting at an appropriate discount factor.
This speaks of present value of forecasts. Present value tables give this discount factor over a period and at discount rate.
Let us take the cash inflows of Orient fans—PMPO are projected for 15 years, and discounted at 13 percent, the following will be the results: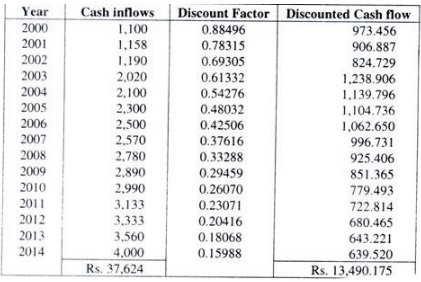
According to this method the purchasing company pays Rs 13,490.18 (rounded figure) Rs. 13,490.18 is the brand equity of Orient Fans PMPO. Though it is sounding well of discounting estimated cash inflow as compared to historical method,
it is rather difficult, if not impossible, to estimate the cash-inflows very accurately over a longer period. Another brand say Cinni might excel Orient PMPO in future.
Again the nature the very industry might undergo a change duet improved technology. Instead of suspend fans, they might be horizontal or very flat yet aerodynamic fixed in walls. In other words, Orient PMPO may not retain its original status. However, this is a suitable method where sales turnovers are stable and more accurately predictable.
5. Brand Contribution Method:
This is an attempt to identify the ‘Brand’ contribution to the product. This ‘Brand Contribution’ compares the profits earned by the brand with profits earned by an unbranded or generic product in the same category.
Accordingly, the difference between the two is treated as a measure of brand value. Of course, this is not acceptable at which the brand can be sold. It is because the buying will have to pay several times the difference to the bought unbranded product.
It can be presented in the form of an equation as under:
BE = K x (Profits from the branded product profits from the unbranded product in the same category.)
Where:
BE = Brand Equity
K = Number of times the difference, let us take a case of shoes manufactured by unknown and the shoes bought or manufactured by Bata Shoe Company. Say the sales of ‘Ambassador’ brand are Rs. 500 million and those of another unknown brand equal to that of ‘Ambassador’ are Rs. 400 million but profits are Rs. 100 million in case of Bata While Rs. 50 million in case of unbranded product. The ‘K’ factor is 8 times, and then the Brand equity will be
8 x (Rs. 100 million Rs. 50 million) = 8 (Rs. 50 million) = 400 million. This method is more useful as the measure of the brand’s strength in the market in which it operates.
6. Inter-brand Method:
The Inter brand Company of United Kingdom developed this method which is structural in arriving at brand equity. It is an attempt to arrive at the value at which a brand can be sold by our company to another. In fact, it is a complicated method involving certain logical steps.
The equation of Brand Equity according to this method is:
B.E. = (Weighted Average of Past Brand Profits x Standard Rate of Return of Industry x Brand Strength).
This involves three steps:
1. The weighted average of the last three year’s profits of the brand computed.
2. Calculating brand strength variable scores say leadership, suitability, internationality, protection, market, trend and so on. This product is a percentage namely point wise total score out of 100 score points.
3. The Brand Equity then will be the product of weight-age, average profits multiplied by Standard Rate and brand Strength.
Let us take a case to understand the derivation of Brand Equity. The Ready Garments Company has give profits for three years. The weight-age given is 2: 3: 4 Profits: 2000, Rs. 25 million 2001, Rs. 31 million and for 2002 Rs. 35 million.
It manufactures T-shirts named as “Smarty”. The standard/Average Rate of Return for industry is 25 per cent or Rs. 25 per share of Rs. 100 each. The brand strength variables are Leadership. Suitability, Internationality, Support Protection, Market and Trend.
Each variable is given the weight-age of 100 points namely 30 to leadership; 15 to Suitability, Internationality 15; Support 15; Protection 5; Market 5 and 15 is for trend. The actual score for each variable as against the earmarked are 17, 8, 3, 8, 3, 3 and 9 respectively.
Accordingly we will calculate weighted average profit for three years.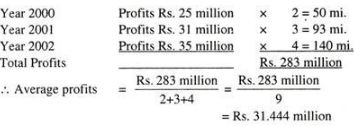
Another step we are proceed is to find out “Brand Strength” which is in the form of a statement: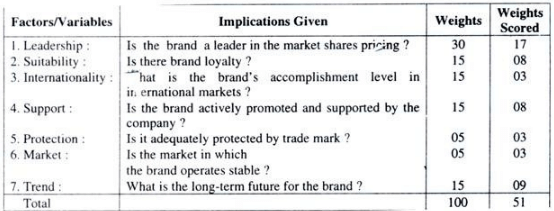
Therefore the Brand Strength will be:
51 points scored/ 100 points earmarked
= 0.51
Hence, Brand Equity = 0.51 x 25% x 31.444
= -0.51 x 25 x 31.444
= Rs. 400.911 million
= Rs. 400.91 million
If a company like Chirag Din wants to buy ‘Smarty’, the first will have to pay Rs. 400.91 million. What important to note is that qualitative factors are quantified. It means that ‘Brand Strength’ is going to be subjective because these are not a single way as to what weight-age is to be given to variables.
One must admit openly that it is almost difficult, if not impossible to totally eliminate the influence of subjectivity even where quantitative methods are used. The rationale of this method is that weighted earnings are related with industry’s earnings rate.
B. Price Based Methods:
Some experts have thought of calculating Brand Equity on the oasis of price particularly retail prices of the brands.
These are:
1. Price Premium Method:
A comparison made of the retail price of a ‘branded’ product with that of unbranded product in the same category. The difference speaks of “brand equity”. It also indicates “brand strength”. It means that higher the retailer premium that a brand can charge, greater is the equity of brand in the minds of a customer.
Since price is the parameter the brand equity cannot be generally acceptable concept. In case of Colgate, we have “Colgate Dental Cream” which is largely used and lowly priced as against “Colgate Total” which is very costly. Even Amway dental cream “Glister” is very much higher than that of Colgate Total.
In case of “Balsaras “Babool” is deliberately priced lowly as compared to “Promise” to enter the market to gain the ground. The implication of this approach of brand equity is that of Low-brand equity or zero brand equity in case of lowly priced branded and unbranded products.
2. Market Share Equalisation Method:
Brand equity is arrived in case of this method in a wiser way if total market sales for say dental cream say 57 per cent is that of Colgate, 18 Promise, Babool 5 percent, Pepsodent say 10 per cent. These are not actual figures or the only brands. One can take different figures and brands. To illustrate let say there are four brands priced for a given quantity say of 100 gram tubes and the number of people using taken out of hundred persons.
Following is the statement configured: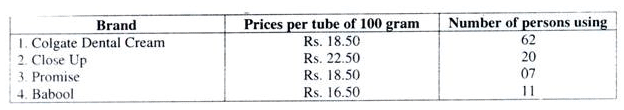
The question is what are the prices at which the market shares for each of these brands equal? Apparently the most popular brand is Colgate Dental Cream. It is obvious that if Colgate Dental Cream raises the prices beyond a particular point, consumers are likely to shift to other brands. Let us take if 37 persons shift from Colgate with big rise in Colgate Dental Cream and marginal rise in other brands.
This gives the following changed picture: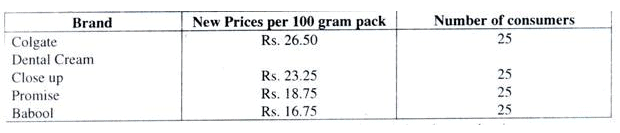
The changed scene created by forced situation, makes it amply clear that all four brands have equal market shares. Here, it is the price that indicates the brand equity. If we express the prices in terms of paise the numbers reflect in ‘Brand Equity” Map.
Colgate Dental Cream – Paise 265.00
Close-Up – Paise 232.50
Promise – Paise 187.50
Babool – Paise 167.50
This Brand Equity Map clears that Brand Equity of Colgate Dental Cream is equal to 265.00 while that of Babool 167.50. That is both Colgate Dental Cream and Close-up are High in terms of Brand Equity while Promise and Babool are low.
This is proved by the study, conducted by the students of Indian Institute of Management covering 51 respondents, reveals that at market share equalisation, Colgate commanded a price premium of 6.12 and Close-up Rs. 2.71. Taking this group of respondents, Colgate enjoys higher “Brand Equity” than ‘Close Up’.
3. Price Premium at Indifference:
This is the method that attempts to compare the free prices of brands at the point of indifference. Let us take two brands say Colgate and Promise. To avoid duplicacy repeat same experiment that was tried in market share equalization method. Keep increasing the price of Colgate from 26.50 to Rs. 27.00. Let us, on an average a customer jumps from Colgate to Promise at Rs. 27.00.
Then the Brand equity of Colgate will be:
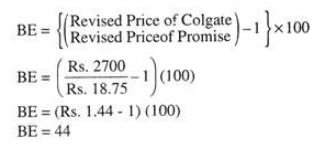
Similar methodology can be used to calculate the brand equity. This method uses one of the brands as ‘anchor point’ to define brand equity. It might so happen that some brands might have negative equity. For instance, if an average customer jumps from Babool to Promise at Rs. 17.00, the Brand Equity of Babool will be:
BE = (Rs. 17.00 / Rs. 18.75 -1) (100)
BE = 0.906- 1
BE = -0.33
As concept of ‘equity’ is relative, it does not matter. Let us equalize B.E. of Babool to zero and rearrange the result.
The rearranged set of facts will reveal:
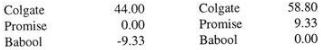
It clearly demonstrates that Colgate has much higher Brand Equity than Promise and Babool. Between Promise and Babool, the latter has least equity.
C. Customer Based Brand Equity:
Customer based methods of Brand Equity are also developed by some veterans. The heart of this approach is the customer’s knowledge about the brand in spot light.
These are:
1. Brand Knowledge Method:
‘Brand Knowledge’ stands for the sum of brand awareness and brand image. Each of the parameters can be measured on a 1-10 scale where standard measures such as recall, associations or attitudes or users image and so on.
A weighted total of these parameters will be the measure of brand equity. The dimensions of Brand Knowledge can be presented in the form of a chart as under for better understanding.
Brand Recall:
It can be better explained with a practical example. To have recall score for a brand, certain questions are asked. There may be four or five questions. Let us take bathing soap brand say “Mysore Sandal”.
One can ask say four questions regarding this soap:
1. What brand comes to your mind when I say toilet beauty soap?
2. Which brand comes to your mind when I say ‘lower price’.
3. Which brand comes to your mind when I say white, cream, and pink?
4. The advertisement for which brand says “Do you now understand why I buy this?
Let us turn to the answers of these in case of a customer. Remember we are asking several customers from different parts of the country-Urban, semi urban- rural-top class, middle class, poor class, educated, uneducated, youngsters, and middle aged and old and so on. Say answer in case first question is ‘Mysore Sandal’, then its Brand Recall is high. Let us give 10 out of 10 points.
If the answer to second question is “Santoor”, then the score point can be say 7 out of 10 points. If the answer to the third question is say, ‘Mysore Sandal’, the score point can be 6 out of 10. If the answer is a correct recall-say ‘Santoor’-he can be given again say 5.
Then the scores are averaged for four questions. In this case, (10 + 7 + 6 + 5 + 4) the average score is 7. This is a measure of Brand Equity. According to this method, the equity does not lie in the price at which brand can be sold but in the mind of the customer.
Even if consideration obtained for selling a brand can be measured, it is argued that this consideration itself depends on how many people like the brand or its customer based brand equity.
The study conducted by the students of Indian Institute of Management Bangalore in case of two items, toilet soap cakes and tooth pastes, the scores that ranged between 0 and 10 are as follows after averaging.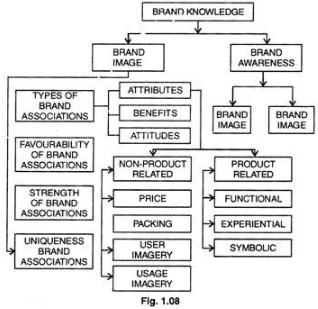
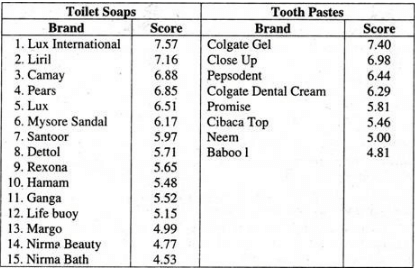
The above piece of information makes it quite clear that amongst the toilet soaps, Lux International has the highest Brand Equity while “Nirma Bath” the lowest. In case of tooth pastes, “Colgate Gel” has the highest Brand Equity while ‘Babool’ has the lowest.
The major problem with this method is that the scores should be valid. The respondents selected must fully be reflective of the social fabric. Unless and until, several such studies are carried out on different products or brands a score cannot be interpreted. Suppose AM. Studies conducted several times, reveal that Colgate has a score of 82.
If Nirma gets 55, the question is whether its equity should be compared in similar or competitive products or brands or non-competitive or different product or brands which are unrelated. The question remains unsolved as to its validation and standardization.
2. Attribute-Oriented Approach:
Under this approach, the methodology is taking the attributes of brands in a particular product area. These attributes are rated in the range of 01 to 10 scales from consumers. The sum of the scores of each brand reflects the Brand Equity of a given product.
Let us take the case of toilet soaps say at least 5 and decide the attributes and get the score from consumers and total the score for each brand to determine the Brand Equity. Even these absolute scores can be expressed as a percentage.
The configuration of scores of five brands and five attributes may be: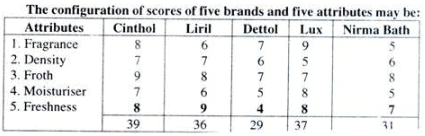
In terms of absolute figures compared ‘Cinthol’ has Highest Brand Equity and ‘Dettol’ has the lowest. Even if percentage is taken, the same ranking will result.
Though it gives weight-age to attributes, the limitation of this method is that Brand Equity stands for more than brand
In terms of absolute figures compared ‘Cinthol’ has Highest Brand Equity and ‘Dettol’ has the lowest. Even if percentage is taken, the same ranking will result.
Though it gives weight-age to attributes, the limitation of this method is that Brand Equity stands for more than brand attributes.
3. Blind Test:
Blind test is a variation method of the earlier attribute. Under this method clear distinction is drawn between subjective and objective attributes. Accordingly Brand Equity is defined as the difference between the overall performance of a brand and the sum of the scores it gets on objective parameters.
Let us take the example of 100 CC mobiles say “Yamha RX”. “TVS Shaolin” and “Hero Honda-Splendour”.
Taking overall brand level, there is preference for one brand or the other. Taking brand level score out of 100 points. A respondent gives or respondents give the score when you ask the question a consumer”. How much does this brand score on hundred according to you?” Say answer is- Yamaha 79, Shaolin 84 and Spendour 88. Let us turn now to score when objective parameters are considered such as fuel consumption that is so many kilometers per liter of petrol; Pick-up so many Kmph in given time duration- Load carrying capacity-its minimum and maximum.
Then there is need of conducting a blind test on these attributes for the brands in question without revealing the brand name to the customer. If following are the average ratings taken from a sample of 300 respondents for each of the objective attributes on a 00 to 10 scale.
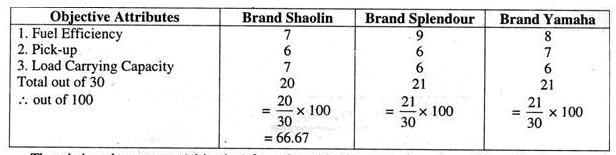
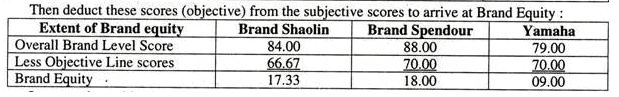
It means that subjective parameters show that Brand Equity is highest for Splendor and lowest for Yamaha. The basic problem is that of identifying the subjective and objective parameters.
It is much easier in case of say two wheelers and four wheelers but not so easy in case of consumer non-durables like talc powder, Shampoo, or say tooth paste and so on. Again very important question arises as to why only we should take into account subjective factors (net) as a measure of Brand Equity?
|
54 videos|51 docs|22 tests
|
FAQs on Branding (Part - 3) - Product Planning and Market Strategies, Marketing Management - Marketing Management - B Com
| 1. What is product planning and why is it important in branding? |  |
| 2. What are the key elements of a market strategy in branding? | |
| 3. How does marketing management contribute to successful branding? | |
| 4. What are some common challenges in product planning and market strategies? | |
| 5. How can companies differentiate their products through effective market strategies? | |

|
4.90/5 Rating |

|
Dec 23, 2024 Last updated |

|
Explore Courses for B Com exam
|
|
ppt
,Branding (Part - 3) - Product Planning and Market Strategies
,Free
,study material
,Important questions
,Exam
,Extra Questions
,Semester Notes
,practice quizzes
,Branding (Part - 3) - Product Planning and Market Strategies
,Previous Year Questions with Solutions
,Marketing Management | Marketing Management - B Com
,Objective type Questions
,Viva Questions
,Branding (Part - 3) - Product Planning and Market Strategies
,MCQs
,Marketing Management | Marketing Management - B Com
,shortcuts and tricks
,past year papers
,Sample Paper
,mock tests for examination
,Marketing Management | Marketing Management - B Com
,Summary
,video lectures
;


Branding (Part - 3) - Product Planning and Market Strategies, Marketing Management Free PDF Download
Importance of Branding (Part - 3) - Product Planning and Market Strategies, Marketing Management
Branding (Part - 3) - Product Planning and Market Strategies, Marketing Management Notes
Branding (Part - 3) - Product Planning and Market Strategies, Marketing Management B Com Questions
Study Branding (Part - 3) - Product Planning and Market Strategies, Marketing Management on the App
|
© EduRev
|
Education Revolution
|


|


