NCERT Solutions: Statistics (Exercise 13.2)


Q1: The following table shows the ages of the patients admitted in a hospital during a year:
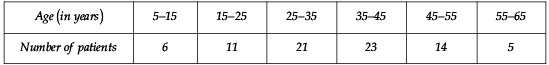
Find the mode and the mean of the data given above. Compare and interpret the two measures of central tendency.
Sol: Mode:
Here, the highest frequency is 23.
The frequency 23 corresponds to the class interval 35 - 45.
∴ The modal class is 35 - 45.
Class size (h) = 10.
Lower limit (l) = 35.
Frequency of the modal class (f1) = 23.
Frequency of the class preceding the modal class (f0) = 21.
Frequency of the class succeeding the modal class (f2) = 14.
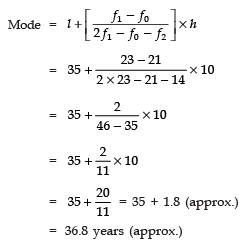
Use the formula Mode = l + (f1 - f0) / (2f1 - f0 - f2) × h.
Substitute values: Mode = 35 + (23 - 21) / (2·23 - 21 - 14) × 10.
Therefore, Mode = 35 + 2/11 × 10 = 35 + 20/11 = 36.818...
Mode ≈ 36.82 years.
Mean
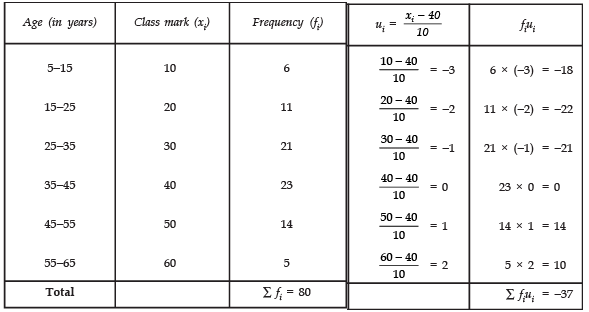
Let assumed mean a = 40.
Class width h = 10.
Apply the assumed mean method (compute di = (xi - a)/h, form fidi and sum).
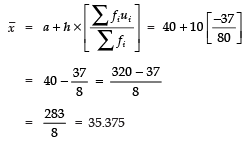
Carrying out the table calculations (as in the provided working) gives the required value.
Mean = 35.37 years.
Comparison and interpretation
The mean (35.37 years) represents the average age of admitted patients, while the mode (≈ 36.82 years) represents the most frequently occurring age (the modal value) in the grouped data.
The two measures are close in value, indicating the distribution is fairly near symmetric with only a slight skew; since the mean is a little less than the mode, this suggests a slight negative (left) skew in the age distribution.
Q2: The following data gives the information on the observed lifetimes (in hours) of 225 electrical components:

Determine the modal lifetimes of the components.
Sol: Here, the highest frequency = 61.
∴ The modal class = 60 - 80.
l = 60.
h = 20.
f1 = 61.
f0 = 52.
f2 = 38.
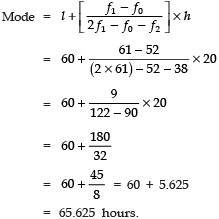
Use the formula Mode = l + (f1 - f0) / (2f1 - f0 - f2) × h.
Substitute values: Mode = 60 + (61 - 52) / (2·61 - 52 - 38) × 20.
Therefore, Mode = 60 + 9/32 × 20 = 60 + 180/32 = 60 + 5.625.
Modal lifetime = 65.625 hours.
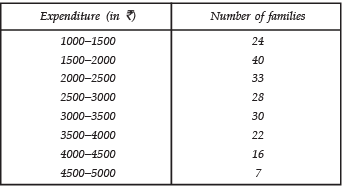
Q3: The following data gives the distribution of total monthly household expenditure of 200 families of a village. Find the modal monthly expenditure of the families. Also, find the mean monthly expenditure:
Sol: Mode:
∵ The maximum number of families 40 have their total monthly expenditure in interval 1500 - 2000.
∴ Modal class is 1500 - 2000.
l = 1500.
h = 500.
f1 = 40.
f0 = 24.
f2 = 33.
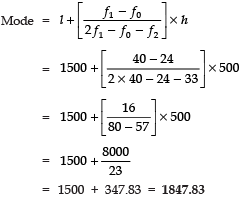
Use the formula Mode = l + (f1 - f0) / (2f1 - f0 - f2) × h.
Substitute values: Mode = 1500 + (40 - 24) / (2·40 - 24 - 33) × 500.
Therefore, Mode = 1500 + 16/23 × 500 = 1500 + 8000/23 = 1847.826...
Modal monthly expenditure ≈ Rs 1847.83.
Mean:
Let assumed mean a = 3250.
Class width h = 500.
Form the table of class mid-points xi, compute di = (xi - a)/h, then fidi, and sum fidi as shown in the working.
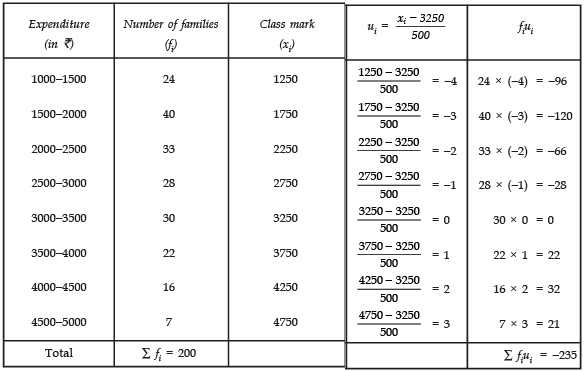
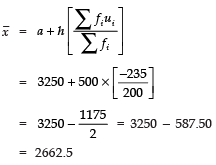
Carrying out the computations yields the required mean.
Mean monthly expenditure = Rs 2662.50.
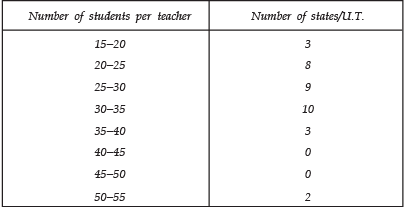
Q4: The following distribution gives the state-wise teacher-student ratio in higher secondary schools of India. Find the mode and mean of this data. Interpret the two measures.
Sol: Mode:
Since the class 30 - 35 has the greatest frequency and h = 5.
l = 30.
f1 = 10.
f0 = 9.
f2 = 3.
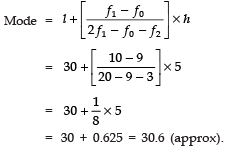
Use the formula Mode = l + (f1 - f0) / (2f1 - f0 - f2) × h.
Substitute values: Mode = 30 + (10 - 9) / (2·10 - 9 - 3) × 5.
Therefore, Mode = 30 + 1/8 × 5 = 30 + 0.625.
Mode ≈ 30.625.
Mean:
Let the assumed mean a = 37.5.
Since, h = 5.
Form the table with class mid-points, compute di = (xi - a)/h, multiply by frequencies, sum fidi, and apply assumed mean formula to obtain the mean.
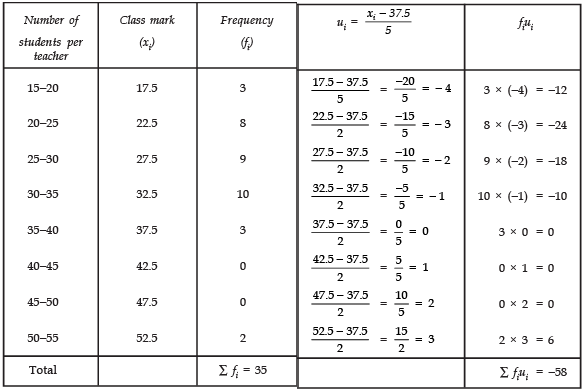
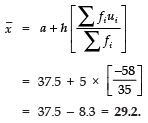
Thus, the required mean is 29.2.
Interpretation
The mean (29.2) gives the average teacher-student ratio across the states represented, while the mode (≈ 30.63) gives the most commonly observed ratio class.
The mean being slightly less than the mode suggests a small negative (left) skew in the distribution of ratios; the two measures are reasonably close, so no extreme skewness is indicated.
Q5: The given distribution shows the number of runs scored by some top batsmen of the world in one-day international cricket matches.
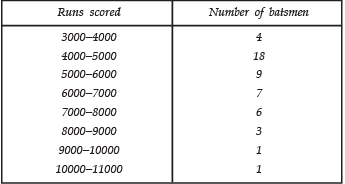
Find the mode of the data.
Sol: The class 4000 - 5000 has the highest frequency i.e., 18.
∴ h = 1000.
l = 4000.
f1 = 18.
f0 = 4.
f2 = 9.
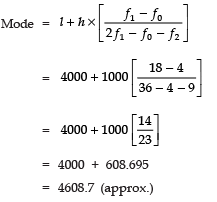
Use the formula Mode = l + (f1 - f0) / (2f1 - f0 - f2) × h.
Substitute values: Mode = 4000 + (18 - 4) / (2·18 - 4 - 9) × 1000.
Therefore, Mode = 4000 + 14/23 × 1000 = 4000 + 608.695...
Mode ≈ 4608.7.
Q6: A student noted the number of cars passing through a spot on a road for 100 periods each of 3 minutes and summarised it in the table given below. Find the mode of the data:

Sol: ∵ The class 40 - 50 has the maximum frequency i.e., 20.
∴ f1 = 20.
f0 = 12.
f2 = 11.
h = 10.
l = 40.
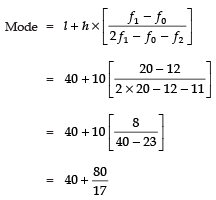
Use the formula Mode = l + (f1 - f0) / (2f1 - f0 - f2) × h.
Substitute values: Mode = 40 + (20 - 12) / (2·20 - 12 - 11) × 10.
Therefore, Mode = 40 + 8/17 × 10 = 40 + 80/17 = 44.705...
Mode ≈ 44.7.
FAQs on NCERT Solutions: Statistics (Exercise 13.2)
| 1. How do I calculate mean, median, and mode from a frequency distribution table? |  |
| 2. What's the difference between ungrouped and grouped data statistics problems? | |
| 3. Why do I need to find cumulative frequency in statistics problems? | |
| 4. How do I use the modal class to find mode in frequency distribution exercises? | |
| 5. What common mistakes should I avoid when solving NCERT Exercise 13.2 statistics questions? | |