Class 9 Maths Chapter 13 Question Answers - Statistics
Question 1. In Summer vacations, Puneet motivated 500 people for blood donation and for this social work he received a cash award of ₹ 10,000. His father advised him to make a budget plan for spending this amount.
He made the following plan :
| S.No. | Head | Amount (₹) |
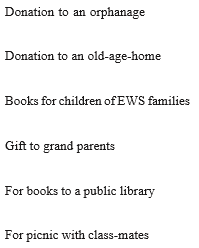
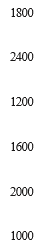
| 1. 2. 3. 4. 5. 6. | Donation to an orphanage Donation to an old-age-home Books for children of EWS families A gift to grandparents For books to a public library For picnic with class-mates | 1800 2400 1200 1600 2000 1000 |
| Total | 10,000 |
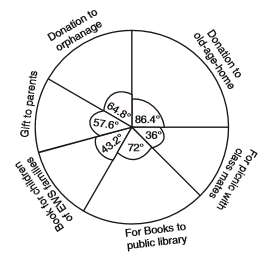
(a) Make a pie-chart for the above data.
(b) Which mathematical concept has been covered in the above problem?
(c) Which values are depicted by Puneet in his budget plan?
Sol. (a) To make a pie-chart, we have to determine central angles corresponding to various heads :
| S.No. | Head | Amount (₹) | Central angle |
 |  |  | 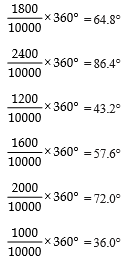 |
| Total | 10,000 | 360° |
The required pie-chart is as given below :
(b) Statistics
(c)(i) gainful use of prize money
(ii) charity
(iii) caring for others
Question 2. 90 schools participated in a plantation programme. Each school planted 100 plants. After one month the number of plants that survived were recorded as :
95 | 67 | 2E | 32 | 65 | 69 | 33 | 98 | 96 |
16 | 42 | 32 | 3E | 42 | 40 | 69 | 95 | 92 |
16 | 83 | 75 | S3 | 85 | 37 | 65 | 63 | 42 |
89 | 65 | 73 | 31 | 49 | 64 | 76 | S3 | 92 |
93, | 68 | 52 | 79 | 81 | 59 | 82 | 75 | 82 |
86 | 90 | 44 | 62 | 31 | 3E | 42 | 39 | S3 |
87 | 56 | 5E | 23 | 35 | S3 | 85 | 30 | 68 |
69 | S3 | 36 | 43 | 45 | S3 | 75 | 66 | S3 |
92 | 75 | 89 | 66 | 91 | SS | 89 | 53 | 42 |
93, | 69 | 90 | 55 | 66 | 52 | S3 | 34 | 36 |
(a) Present the data in a frequency table using classes 20-29, 30-39, ..... 90-99.
(b) From the table find the number of schools where 50% or more plants survived?
(c) Which mathematical concept is used in the above problem?
(d) By taking part in the plantation programme which value is depicted by the participating schools?
Sol. (a) The required frequency table is given as:
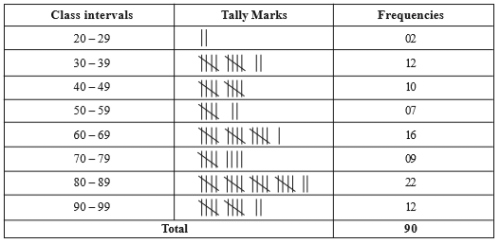
(b) Total number of plants planted by each school = 100
∴ 50% of 100 = 50
⇒ Number of schools where 50% or more plants survived = 07 + 16 + 09 + 22 + 12 = 66
(c) Statistics
(d) Betterment of environment.
Question 3. 40 students of class IX contributed different amounts to Prime Minister’s Relief Fund. Vinod and Preeti were assigned to determine the mean amount of the class. Vinod comes out with his answer as ₹160 but Preeti found that the value of ₹165 was wrongly copied as ₹125 by Vinod and she gave the correct answer.
(a) Find the correct mean.
(b) Which concept of mathematics is used in the above problem?
(c) Which values are depicted by Preeti and other students of class IX?
Sol. (a) Total number of students = 40
⇒ Number of observations = 40
∵ Mean calculated by Vinod = 160
∵ Total of 40 observations = 40 × 160 = 6400
But the observation 165 is recorded as 125
∴ Actual total of the 40 observations = (6400 – 125) + 165 = 6440
⇒ Correct mean calculated by Preeti = (6440/40)= 161
Thus, the correct mean is 161.
(b) Statistics
(c)(i) Accuracy
(ii) Patriotism
Question 4. Mrs. Prabha is a mathematics teacher in a school. She motivated 60 students from 2 sections of class IX to appear in proficiency-test in mathematics. The marks obtained by the students are as :
57 | 31 | 46 | 74 | 6S | 42 | 54 | 14 | 61 | 33 | 48 | 37 |
26 | 8 | 64 | 93 | 72 | 53 | 59 | 38 | 16 | 88 | 75 | 56 |
46 | 66 | 45 | 61 | 54 | 27 | 27 | 44 | 63 | 58 | 43 | 31 |
61 | 67 | 36 | 49 | 50 | 76 | 38 | 47 | 55 | 77 | 62 | 53 |
40 | 71 | 60 | 58 | 45 | 42 | 34 | 46 | 40 | 59 | 42 | 29 |
(b) Find the number of students who secured more than 49 marks.
(c) Which mathematical concept is used in the above problem?
(d) By encouraging students of class IX in proficiency-test, which skill is depicted by Mrs. Prabha?
Sol. (a)
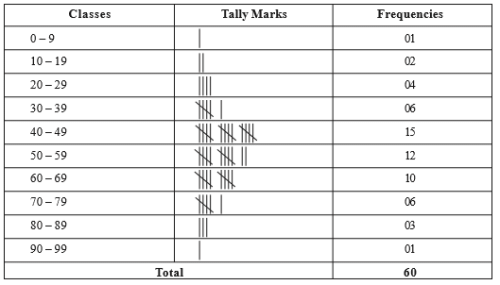
(b) From the above frequency-table, we find that :
Number of students securing more than 49 marks = 12 + 10 + 6 + 3 + 1 =32
(c) Statistics
(d) Group inspiration.
Question 5. 30 students from senior classes of a school plan to donate blood in a blood donation camp.
Their blood groups are recorded as follows :
B, | A, | o, | o, | AB, | o, | A, | 0 |
B, | A, | B, | A, | o, | o, | A, | AB |
o, | A, | A, | o, | o, | AB, | B, | A |
o, | B, | A, | o, | B, | 0 |
| |
(a) Represent the given data in the form of a frequency distribution table.
(b) Which is the most common blood group?
(c) Which mathematical concept is used in the above problem?
(d) By donating blood, which value is depicted by the students of senior classes?
Sol. (a)
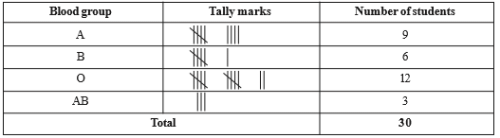
(b) The most common blood group is ‘O’.
(c) Statistics
(d) Sacrificial act.
|
44 videos|412 docs|54 tests
|
FAQs on Class 9 Maths Chapter 13 Question Answers - Statistics
| 1. What is the importance of statistics in Class 9? |  |
| 2. What are the different types of data that can be analyzed in statistics? | |
| 3. How do you calculate the mean in statistics? | |
| 4. What is the difference between a sample and a population in statistics? | |
| 5. What is the purpose of using measures of central tendency in statistics? | |

|
4.66/5 Rating |

|
Dec 23, 2024 Last updated |

|
Explore Courses for Class 9 exam
|
|
MCQs
,mock tests for examination
,Free
,Extra Questions
,Sample Paper
,Viva Questions
,Class 9 Maths Chapter 13 Question Answers - Statistics
,practice quizzes
,Summary
,ppt
,video lectures
,Class 9 Maths Chapter 13 Question Answers - Statistics
,Exam
,shortcuts and tricks
,study material
,Previous Year Questions with Solutions
,past year papers
,Important questions
,Class 9 Maths Chapter 13 Question Answers - Statistics
,Semester Notes
,Objective type Questions
;


Value-Based Questions: Statistics Free PDF Download
Importance of Value-Based Questions: Statistics
Value-Based Questions: Statistics Notes
Value-Based Questions: Statistics Class 9
Study Value-Based Questions: Statistics on the App
|
© EduRev
|
Education Revolution
|


|


