CBSE Class 11 Economics Sample Paper - 2 | Economics Class 11 - Commerce PDF Download
Time : 3 Hours
Maximum Marks : 80
General Instructions:
- This question paper contains two sections:
Section A – Statistics for Economics Section B – Introductory Micro Economics - This paper contains 20 Multiple Choice Questions type questions of 1 mark each.
- This paper contains 4 Short Answer Questions type questions of 3 marks each to he answered in 60 to 80 words.
- This paper contains 6 Short Answer Questions type questions of 4 marks each to he answered in 80 to 100 words.
- This paper contains 4 Long Answer Questions type questions of 6 marks each to he answered in 100 to 150 words.
Q1: Read the following Assertion (A) and Reason (R) and choose the correct alternative: [1 Mark]
Assertion (A): Diagrammatic representation of data makes the data very simple and intelligible.
Reason (R): It helps in the proper analysis of the data and helps in the comparative study of the data.
(a) Both Assertion (A) and Reason (R) are true, and Reason (R) is the correct explanation of Assertion (A)
(b) Both Assertion (A) and Reason (R) are true, but Reason (R) is not the correct explanation of Assertion (A)
(c) Assertion (A) is true, but Reason (R) is false.
(d) Assertion (A) is false, but Reason (R) is true.
Ans: (a)
Diagrammatic representation makes it easier to analyse the data properly with a proper comparison.
Q2: Airways publish data regarding progress of airways. What type of data is this for an investigator? [1 Mark]
(a) Primary
(b) Secondary
(c) Tertiary
(d) None of these
Ans: (b)
As the investigator will use the already published data, it is a type of secondary source of data.
Q3: Wealth oriented definition of Economics was given by: [1 Mark]
(a) Adam Smith
(b) Marshall
(c) Robinson
(d) None of the these
Ans: (a)
According to Adam Smith, “Economics is an enquiry into the factors that determine the wealth of a country and its growth”.
Q4: There are two statements given below, marked as Statement (I) and Statement (II). Read the statements and choose the correct option: [1 Mark]
Statement -I: Microeconomics studies the economic behaviour of individual economic units.
Statement – II: Estimation of national income can be learning in microeconomics studies.
(a) Only I is true
(b) Only II is true
(c) Both I & II are true
(d) Both I & II are false.
Ans: (a)
Yes, it is true. It studies the economic behaviour of individual economic variables. Measures of National Income are subject matter of macroeconomics instead of Microeconomics.
Q5: Statistics is a science as well as_________ . [1 Mark]
(a) Art
(b) Philosophy
(c) Psychology
(d) Mathematics
Ans: (a)
Statistics is a science as well as an art. As an art, Statistics relates to quantitative data to real life problems.
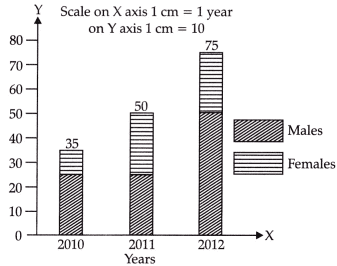
Q6: Identify the following diagram:
 (a) Pie Diagrams
(b) Deviation Bar Diagram
(c) Percentage Bar Diagram
(d) Sub-divide Bar Diagram
Ans: (d)
Subdivide Bar Diagram represent total values as well as part values of a set of data. In the given picture, the different part of bars shows the same order for all bars of a diagram.
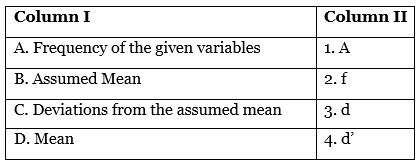
Q7: Identify the correct pair of terms with their common symbols from the following Columns I and II: [1 Mark]
(a) A – 1
(b) B – 2
(c) C – 3
(d) D – 4
Ans: (c)
A. Frequency of the given variables should match with 2. f, as frequency is commonly represented by f.
B. Assumed Mean does not match with 2. f; instead, it's often denoted by A.
C. Deviations from the assumed mean should match with 3. d, as deviations are commonly represented by d.
D. Mean does not typically match with 4. d'; it’s usually denoted by symbols such as x bar or M.
Thus, the correct answer is: (c)
Q8: Which of the following statements is true about the significance of Economics: [1 Mark]
(a) Economics helps in the study of the laws of motion.
(b) Economics helps in the study of man and environment.
(c) Economics helps in saving the mankind.
(d) Economics helps in solving the problem of distribution.
Ans: (d)
Human wants are unlimited and resources are limited. Economics helps in solving the problem of distribution of limited resources among unlimited wants.
Q9: There are two statements given below, marked as Statement (I) and Statement (II). Read the statements and choose the correct option: [1 Mark]
Statement (I) – Consumer Price Index is used in calculating purchasing power of money.
Statement (II) – CPI also known as cost of living index:
(a) Statement I is true and statement II is false
(b) Statement I is false and statement II is true
(c) Both statements I and II are true
(d) Both statements I and II are false
Ans: (c)
Both statements 1 and 2 are true. Consumer Price Index is known as cost of living index and it measures the average change over time in the prices paid by the ultimate consumer for specific basket of goods and services. So it is used in calculating purchasing power of money.
Q10: With the help of an ogive curve, we find: [1 Mark]
(a) Arithmetic Mean
(b) Median
(c) Mode
(d) All of these
Ans: (b)
Arithmetic mean is not found with any curve. Mode is found by the Histogram. Thus, only Median is found with the help of an Ogive.
Q11: Distinguish between random sampling and systematic sampling. Give suitable examples. [3 Marks]
Ans:
- Simple Random Sampling: This method is also called ‘Probability Sampling’. When all the items of the universe have the ‘equal probability’, i.e., equal chance of being selected in the sample set, it is called random sampling. In this method, the investigator has no choice of selecting or leaving any particular item of the population while selecting the sample from the universe.
- Systematic Sampling: In this method, units of the population are numerically, geographically or alphabetically arranged. Every item after a fixed number in the arranged series is selected as a sample item. To illustrate, if 10 out of 200 students are to be selected for a sample, then 200 students would be numbered and systematically arranged. One item out of the first 20 would be selected at random. Subsequently, every 20th item out from the selected number will be selected to frame a sample. If the first selected number is 4th item, then the subsequent numbers would be 24th, 44th, 64th, 84th, 104th, 124th, 144th, 164th and 184th. This method of sampling is, in fact, a short-cut method of Random Sampling.
Q12: Calculate median from the following series: [3 Marks]
 OR
ORIf the arithmetic mean of the data given below is 28, then find out the missing frequency:

Ans:
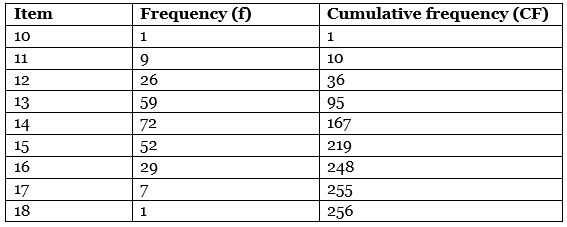
M = Size of  item
item
Size of item
item
Size of (128.5) item = 14
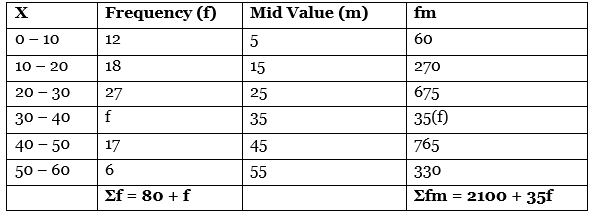
Mean value = ∑fm / ∑f
28 = 2100 + 35f / 80+f
28 (80 + f) = 2100 + 35f
⇒ 2240 + 28f = 2100 + 35f
⇒ 140 = 7f
⇒ f = 140/7
= 20
Hence, the missing frequency is 20.
Q13: Explain any three merits of a statistical table. [4 Marks]
Explain the definition of Economics given by Robbins?
Ans: Following are the merits of a statistical table:
- Simple Presentation: Tabular presentation is the most simplest form of data presentation. Data are easily understood if tables are systematically prepared.
- Helps in comparison: The tabular presentation facilitates comparison of data by presenting the data properly in rows and columns.
- Special Emphasis: Tabulation highlights important characteristics of data. Accordingly, it becomes easy to draw inferences from it.
Professor Robbins has defined Economics as a science of choice. According to him, Economics is the science which studies human behaviour in relation with unlimited wants of individual and limited or scarce resources. That’s how an individual chooses a combination of goods among different goods to satisfy his/her wants along with limited amount of money.
Human wants are unlimited and no one can satisfy all of the wants fully because resources to satisfy them are limited. As an individual satisfies one want at a particular time, another want crops up and a human being is interwoven into the web of different wants having never ending circle of wants. Everyone tries to make efforts to satisfy his/her wants with limited means and chooses only few wants among various.
Q14: Calculate the median from the following data: [4 Marks]
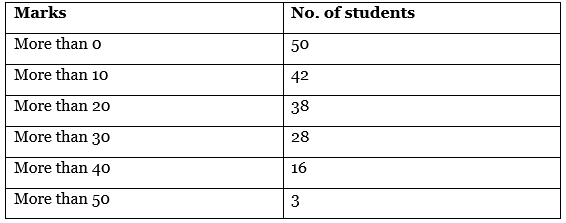
Ans: Given data is cumulative frequencies distribution, so firstly we convert them into simple frequencies.
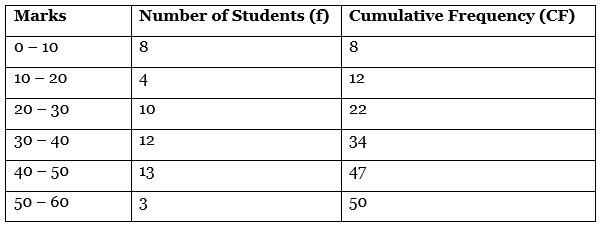
Calculation of Median
Median value = Size of (N/2)th Item
= Size of (50/2)th Item
= Size of 25th item (which lies in 30 – 40 marks group)
By Interpolation:
Median = 
Where,L1 = 30, C.F = 22 f = 12 i = 10
Thus, put the above value in formula
Median = 30 + 25 − 22 / 12 × 10
= 30 + 2.5
= 32.5
Q15: “Different index numbers are constructed to fulfill different objectives and before setting to construct a particular index number, one must clearly define one’s object of study.”
Elaborate the problems which are faced in construction of Index number of prices. [4 Marks]
Statistics are figures, but all figures are not statistics’. Justify the statement.
Ans: There are various types of index numbers constructed with different objectives. Before constructing an index number, one must define the objective. The construction of index number is significantly influenced by the objective or purpose of the study. Thus, for example, if the objective is to study the impact of change in the value of money on the consumers, one should construct consumers’ price index number. If we are to study the impact of change in the purchasing power of money on the producers, we shall construct index number on the basis of wholesale prices. Haberler has rightly pointed out that, “Different index numbers are constructed to fulfil different objectives and before setting to construct a particular index number one must clearly define one’s object of study because, it is on the objective of the study, that the nature and format of the index number depends.”
Statistics is often regarded as being a means by which observations are expressed numerically in order to investigate casual relationship between the variables. Any fact, to be called statistics must be numerically expressed (so that it can be counted, divided or be subject to mathematical analysis) and should be placed in relation to each other. But qualitative data cannot be included in statistics unless they are quantified by assigning some figures for assessment. However, not all numbers are comparable and measurable. For example: The fact that height of a student is five feet tells nothing unless it is comparable. Thus, for figures to be included in statistics, they must be aggregate of facts and not individual figures. That is why it is rightly said that statistics are figures but all figures are not statistics.
Q16: (a) Why do we need an index number? [3 Marks]
(b) What are the desirable properties of the base period? [3 Marks]
(a) Discuss the characteristics and limitations of Index Numbers.
(b) What is meant by Consumer Price Index? Explain any two uses of CPI. [3 Marks]
Ans: (a) An index number is a statistical device that is used to measure the changes in the related variables.
Its importance is explained in the following points:
- To measure change in the price level: Index numbers measure and compare prices of different commodities with the help of Wholesale Price Index (WPI). It is widely used to measure the level of inflation in an economy.
- To study a change in the standard of living: Index numbers help to assess the living standard of people. Cost of living index measures the relative cost of living over time. If the index number has a low value, then it implies that people have low standard of living and vice-versa.
- Useful in planning and decision making: Index numbers serve as the most important tool for business communities for drafting various plans and designing various policies. It is useful for the government and the planners to work out inflation rate with the help of consumer price index.
- To determine the level of production: Index number of Industrial Production measures changes in the physical volume of production. Also, the production index is an important indicator to ascertain the output level.
- To help the government in framing policy: Index numbers are of great help to the government to frame fiscal and monetary policies. The government formulates policies regarding inflation, trade, income, salaries and allowances.
(b) The base period should have the following desirable properties:
(i) The base year should not be either too short or too long: It should not be either less than a month or more than a year for calculation purpose.
(ii) The base year should not belong to too near or too far: Statisticians compare the current year’s conditions with the conditions in the base year. So, if the base year is too far from the current year, then the comparison becomes meaningless. Similarly, if the base year is too near to the current year, then comparison fails to capture the change in the taste, preferences, fashion, etc. Thus, in order to conduct a meaningful comparison, the base year should not be either too far or too near to the current year.
(iii) The base year should be so selected that the data for the same should be available: The data for a year should be available in order to regard that particular year to be the base year. This enables one to draw conclusions, inferences and for making comparisons.
(iv) The base period should be constantly updated: The base year should be constantly updated due to the changes in taste, preferences and fashion, otherwise the comparison becomes misleading or inconclusive.
(a) Index Number is the technique of measuring relative changes in the magnitude of variable or a group of related variables over a time with respect to some base year.
Characteristics of Index Numbers:
- Expressed in numbers
- Relative measure.
Limitations of Index Numbers:
- They are simply rough indications of the relative changes.
- The choice of representative commodities may lead to fallacious conclusions as they are based on samples.
(b) CPI also known as cost of living index. CPI measures the average change over time in the prices paid by the ultimate consumer for specific basket of goods and services.
Uses:
- The most common use of this index number is in wage negotiations and wage contracts for industrial workers.
- It is used in calculating purchasing power of money and real wages.
- It is used as guidelines by government for deciding wage policy, price policy or income policy.
Q17: (a) The following table shows the estimated sector real growth rates (percentage change over the previous year)
in GDP at factor cost. [3 Marks]
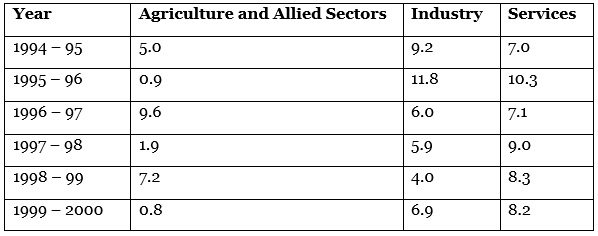
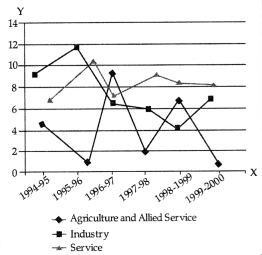
Represent the data as multiple series graph.
(b) Distinguish between a Bar diagram and a Histogram. [3 Marks]
Ans: (a) Graph showing estimated real growth rates in agriculture sector, industry and service sector is given below:
 (b) Differences between Bar Diagram and Histogram:
- The spacing and the width or the area of bars are all arbitrary. It is the height and not the width or the area of the bar that really matters. But the width in a histogram is as important as its height.
- Bar diagram can be drawn both for discrete and continuous variables but histogram is drawn only for continuous variables.
- In bar diagram some space must be left between consecutive bars; but in histogram no space is, left between two rectangles.
Q18: Identify the complimentary goods from following: [1 Mark]
(a) Tea and Coffee
(b) Butter and margarine
(c) Computer hardware and software
(d) Milk and cold drinks
Ans: (c)
Computer hardware and software are paired demand. Demand for hardware will also create demand for software. Complementary goods are positively related with each other. Rise in quantity demanded of one good also brings the increment in quantity demanded of paired goods.
Q19: Identify the false statement regarding price elasticity of demand: [1 Mark]
(a) Estimation of price elasticity of demand is useful for trade union.
(b) Giffen goods have a positive price elasticity of demand.
(c) Necessities and medical treatments tend to be inelastic.
(d) Price elasticity is the ratio between income and quantity demanded.
Ans: (d)
Price elasticity of demand is the ratio between percentage change in quantity demanded of a product to the percentage change in price of commodity.
Q20: “There are legal barriers to the entry of new firm”. [1 Mark]
Identify the above form of market.
(a) Perfectly competitive markets
(b) Monopoly markets
(c) Monopolistic form of market
(d) Oligopoly markets
Ans: (b)
Monopoly is a form of market in which single seller is found in the market because there are legal barriers to the entry of new firm.
Q21: Identify the under – utilisation of resources in production possibility curve [1 Mark]
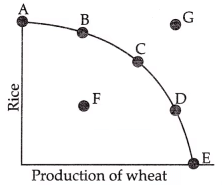 (a) Point – A
(b) Point – B
(c) Point – F
(d) Point – G
Ans: (c)
At point F, the resources are underutilised or inefficiently utilized.
Q22: Which of the following is cause of an increase in quantity demanded: [1 Mark]
(a) Decrease in the price of the product
(b) Increase in consumer’s income
(c) Increase in price of substitute goods
(d) All of these
Ans: (d)
Increase in quantity demanded will be due to:
- Decrease in the price of the product
- Rise in income
- Increase in price of substitute goods
- Decrease in price of complementary goods.
Q23: There are two statements given below, marked as Assertion (A) and Reason (R). Read the statements and choose
the correct option: [1 Mark]
Assertion (A): MC should cut MR from below.
Reason (R): After equilibrium point MC should be greater than MR or MC is rising.
(a) Both Assertion (A) and Reason (R) are true, and Reason (R) is the correct explanation of Assertion (A).
(b) Both Assertion (A) and Reason (R) are true, but Reason (R) is not the correct explanation of Assertion (A).
(c) Assertion (A) is true, but Reason (R) is false.
(d) Assertion (A) is false, but Reason (R) is true.
Ans: (b)
MC should cut the MR from below at the point of equilibrium as beyond that point MR will be less than MC and so the producer will incur losses after this point.
Q24: There are two statements given below, marked as Statement (I) and Statement (II). Read the statements and choose the correct option: [1 Mark]
Statement – I: Explicit and implicit are examples of selling cost of goods and services.
Statement – II: Imputed interest on self-finance is implicit cost.
(a) Statement I is true and Statement II is false
(b) Statement I is false and Statement II is true
(c) Both statements I and II are true
(d) Both statements I and II are false
Ans: (b)
Both implicit and explicit cost refers to the expenditure occurred by the producer for the production of goods and services. Imputed interest on self-finance is implicit cost because owner actually does not pay but it is a cost.
Q25: Which of the following statement is incorrect regarding law of demand? [1 Mark]
(a) Price and quantity demanded have inverse relation.
(b) A consumer buy less of a commodity when his tastes shifts against the commodity.
(c) When price of a commodity increases, the demand of inferior goods decreases.
(d) None of the above
Ans: (c)
Giffen goods are the exceptions of law of demand. When income of a consumer increases, the demand of inferior goods decreases
Q26: There are two statements given below, marked as Statement (I) and Statement (II). Read the statements and choose the correct option: [1 Mark]
Statement -1: An economy can never operate outside the PPF with the given resources and technology. Statement – II: The PPF represents the concepts of scarcity.
(a) Statement I is true and Statement II is false
(b) Statement I is false and Statement II is true
(c) Both statements I and II are true
(d) Both statements I and II are false
Ans: (c)
Both the statements are correct. Production possibility frontier diagrammatically represents the different combination of production when available resources are limited or scarce, as all points outside the PPF are unattainable.
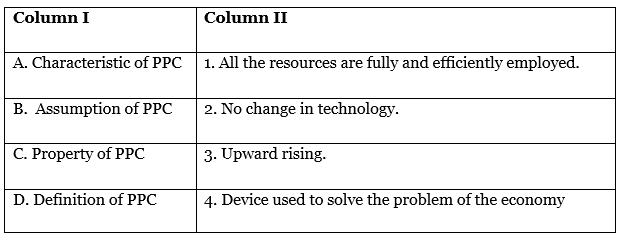
Q27: Identify the correctly matched examples from Column I to that of Column II [1 Mark]
(a) A – 1
(b) B – 2
(c) C – 3
(d) D – 4
Ans: (b)
- A. Characteristic of PPC should match with 1. All the resources are fully and efficiently employed, as a key characteristic of the Production Possibility Curve (PPC) is the efficient use of all available resources.
- B. Assumption of PPC should match with 2. No change in technology, because one of the assumptions of the PPC is that technology remains constant.
- C. Property of PPC does not match with 3. Upward rising because the PPC is typically downward sloping, showing the trade-off between two goods.
- D. Definition of PPC does not match well with 4. Device used to solve the problem of the economy because the PPC itself is a graphical representation of opportunity costs and trade-offs rather than a direct problem-solving device.
Thus, the correct answer is: (b)
Q28: Comment on the statement – “There is perfect knowledge of everything in a perfectly competitive market – both buyer and seller have perfect knowledge about market of goods and inputs used in production.” [3 Marks]
Ans: In a perfectly competitive market, the number of buyers and sellers is very large and all the buyers and sellers have perfect knowledge about the market. As a result no individual buyer or seller can influence the price in the market. In a perfect competition, the products are homogeneous and carry the same price. By implication, this means the cost of the inputs used by the producers will be same. As a result of this, all sellers have perfect knowledge about the inputs used in the production.
Q29: “In the long run a perfect competitive firm can never earn super-normal profits.” Justify. [3 Marks]
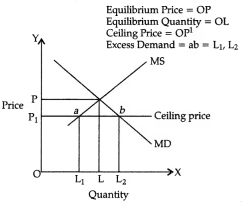
Explain the effects of ‘maximum price ceiling’ on the market of a good. Use diagram.
Ans: Under perfect competition, there is freedom of entry to firms into industry. When there are abnormal profits, new firms will enter as they will be attracted by the profits. This will increase supply in the market leading the price to fall. This process will continue till abnormal profits are wiped out.
Ceiling means maximum limit. Price ceiling means maximum price of a commodity that the sellers can charge from the buyers. Often the government fixes this price much below the equilibrium market price of a commodity so that it becomes within the reach of the poorer sections of the society.
When government fixes price of OP1, demand for bajra extends from OL to OL2 – On the other hand, supply contracts from OL to OL1. Consequently, a gap emerges between market demand and market supply. It is a situation when MD > MS. It is called a situation of excess demand. In the diagram, excess demand = ab = L1L2 (OL2 – OL1). Excess demand for bajra would have its own implications. Significantly, people fail to buy bajra to the extent they wish to buy. Accordingly, a situation of partial hunger may continue to exist.
Q30: Price elasticity of demand of a good is -1. At a price of ₹10 per unit its demand is 500 units. At what price will its demand increase by 20 percent? [4 Marks]
Ans: Price Elasticity of Demand (Ed) = (-) 
Given, Ed = (-)1, P = ₹10, Q = 500, P1 = ?, Q1 = Increase by 20%
Q = 500, Q1 = 20% of 500 or 100 + 500 = 600
∴ ΔQ = 600 – 500 = 100
Now – (1) = 
(-) 500 × ΔP = 1,000 orΔP = (-) 2
New price = P + ΔP = (-) 2 + 10 = ₹8
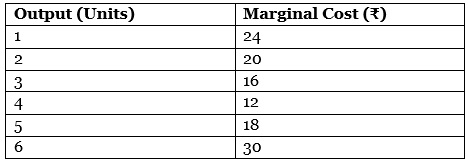
Q31: Calculate Average Variable Cost at each level of output: [4 Marks]
Distinguish between positive economics and normative economics. Give an example of each.
Ans: Calculation of AVC
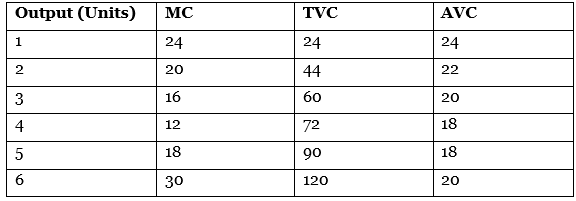
By adding successive units of MC, we get TVC
Positive economics is the branch of economics that concerns the description and explanation of economic phenomena. It focuses on facts and cause and effect behavioural relationships and includes the development and testing of economic theories. Positive economics is objective and facts based. Whereas, normative economics is a part of economics that expresses value or normative judgments about economic fairness or what the outcome of the economy or goals of public policy ought to be. Normative economics is subjective and value based. For example, the statement, “government- provided healthcare increases public expenditures” is a positive economic statement and the statement, “government should provide basic healthcare to all citizens” is a normative economic statement.
Q32: Explain the change that will take place in the market when market price of goods is greater than its equilibrium price. Use diagram. [4 Marks]
Ans:
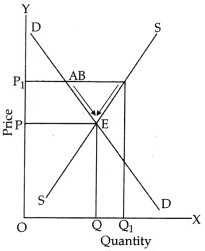 Given equilibrium price OP suppose market price is OP1, the changes that will take place are :
- There is excess supply equal to AB leading to competition among sellers.
- This leads to fall in market price as a result of which demand starts rising and supply starts falling.
- The changes stop when D = S at E and equilibrium price is reached at OP.
Q33: (a) Distinguish between a centrally planned economy and a market economy.
(b) What do you understand by positive economic analysis?
(a) What do you mean by the production possibilities of an economy?
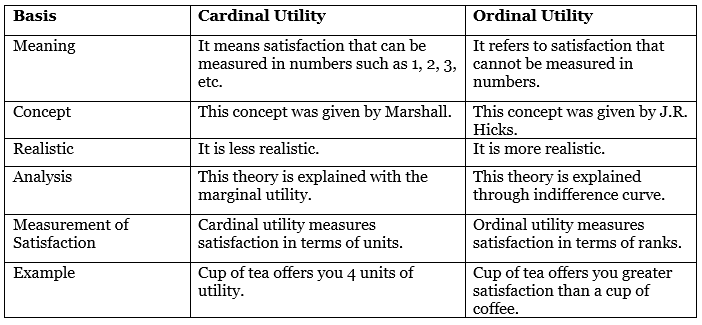
(b) Differentiate between Cardinal Utility and Ordinal Utility.
Ans: (a) In a centrally planned economy, the government or the central authority plans all the important activities in the economy. All important decisions regarding production, exchange and consumption of goods and services are made by the government. The central authority may try to achieve a particular allocation of resources and a consequent distribution of the final combination of goods and services which is thought to be desirable for society as a whole. In a market system, all goods or services come with a price (which is mutually agreed upon by the buyer and the sellers) at which the exchanges take place. The price reflects, on an average, the society’s valuation of the goods or services in consideration. If the buyers demand more of a certain good, the price of that good will rise. This will send a signal to the producer of that good to increase production of goods. In this way, prices of goods and services send important information to all the individuals across the market and help in achieving coordination in a market system.
(b) Positive economics is the branch of economics that concerns the description and explanation of economic phenomena. It focuses on facts and cause and effect behavioural relationships and includes the development and testing of economic theories. Positive economics is objective and fact based. For example, the statement, “government-provided healthcare increases public expenditures” is a positive economic statement.
(a) The resources of an economy are limited in comparison to what the people in the economy want to have. The scarce resources have alternative usages and every society has to decide on how much of each of the resources to use in the production of different goods and services. So, every society has to determine how to allocate its scarce resources to different goods and services. An allocation of the scarce resources of the economy gives rise to a particular combination of different goods and services. Given the total amount of resources, it is possible to allocate the resources in many different ways and, achieving different mixes of all possible goods and services. The collection of all possible combinations of the goods and services that can be produced from a given amount of resources and a given stock of technological knowledge is called production possibilities of the economy.
(b)
Q34: Read the passage given below and answer the questions that are followed: [6 Marks]
A price floor is the lowest legal price that can be paid in a market for goods and services, labour, or financial capital. Perhaps the best-known example of a price floor is the minimum wage, which is based on the normative view that
someone working full time ought to be able to afford a basic standard of living.
(a) Define Price Floor. What is the common purpose of fixation of floor price by the government? Explain any one likely consequence of this nature of intervention by the government. [3 Marks]
(b) Discuss “surplus amount of production as a direct consequence of price flooring”. [3 Marks]
Ans: Price Floor : A price floor is the lowest legal price of a commodity at which it can be sold, and is fixed by the government. Price floors are used by the government to prevent prices from being too low. The main reason for imposing the price floor policy is the welfare of the producers/farmers. E.g.: minimum wages, minimum support price.
Consequence:
- Buffer Stock : In order to maintain the minimum support price, the government may have to build buffer stocks to enable producers to dispose of their surplus stocks. The government purchases the surplus stocks available with the farmers/producers. These stocks are released in case the production of the supported commodity suffers.
(b) The quantity actually brought and supplied will shrink as a direct consequence of price flooring, as a result, a part of producer’s stock will remain unsold. As shown in the figure the surplus of Q’Q” arises.
DD and SS are market demand and market supply curves intersecting at E. OQ quantity (equilibrium quantity) would be offered for sale and demanded by the buyers at OP price (equilibrium price) per unit. The industry is in equilibrium.
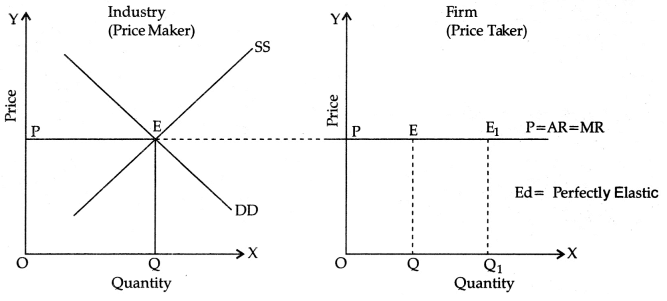 DD and SS are market demand and market supply curves intersecting at E.
QQ quantity (equilibrium quantity)would be offered for sale and demanded by the buyers at OP price (equilibrium price) per unit. The industry is inequilibrium.
|
59 videos|222 docs|43 tests
|
FAQs on CBSE Class 11 Economics Sample Paper - 2 - Economics Class 11 - Commerce
| 1. What are the key topics covered in the CBSE Class 11 Economics syllabus? |  |
| 2. How can students prepare effectively for the CBSE Class 11 Economics exam? |  |
| 3. What types of questions are typically asked in the CBSE Class 11 Economics exam? |  |
| 4. How important are diagrams and graphs in the CBSE Class 11 Economics exam? |  |
| 5. What is the marking scheme for the CBSE Class 11 Economics exam? |  |


