NCERT Solutions - Collection of Data

Q1: Frame at least four appropriate multiple-choice options for the following questions:
(i) Which of the following is the most important when you buy a new dress?
Ans:
a. Colour
b. Brand
c. Price
d. Size
Explanation: These four options cover the main considerations buyers usually have: colour and size are personal preferences and fit, while price and brand reflect affordability and perceived quality. The options are clear and non-overlapping.
(ii) How often do you use computers?
Ans:
a. Less than 1 hour a day
b. 1 to 3 hours a day
c. 3 to 5 hours a day
d. More than 5 hours
Explanation: These time bands are mutually exclusive and cover the full range of likely daily use, making responses easy to categorise.
(iii) Which of the following newspaper/s do you read regularly?
Ans:
a. The Times of India
b. The Hindustan Times
c. Indian Express
d. The Tribune
Explanation: Listing named newspapers allows respondents to indicate habitual readership. A follow-up option such as "Other (please specify)" could be added if required.
(iv) Rise in the price of petrol is justified.
Ans:
a. Strongly agree
b. Agree
c. Neutral
d. Disagree
e. Strongly disagree
Explanation: This five-point Likert scale captures strength and direction of opinion, which helps measure intensity of attitudes.
(v) What is the monthly income of your family?
Ans:
a. Less than Rs 10,000
b. Rs 10,000 to Rs 20,000
c. Rs 20,000 to Rs 30,000
d. More than Rs 30,000
Explanation: Income categories should be mutually exclusive and cover the full range; these bands allow easy classification for analysis. For sensitive questions, consider adding an option "Prefer not to say".
Q2: Frame five two-way questions (with 'Yes' or 'No').
Ans:
a. Do you smoke?
b. Do you use cosmetics daily?
c. Have you ever been to any foreign country?
d. Are you satisfied with your present income?
e. Do you have a two-wheeler?
Explanation: Two-way (Yes/No) questions are useful when the objective is to obtain clear, dichotomous responses. Ensure questions are unambiguous and not leading; consider respondent privacy for sensitive items like smoking or income satisfaction.
Q3: State whether the following statements are True or False:
(i) There are many sources of data.
Ans: False
Explanation: There are two main sources of data: primary and secondary. Primary data are collected from the original source for the current study. Secondary data are already collected by someone else earlier and are reused for the present study.
Primary source: collection of data from its original source. Secondary source: data already collected by somebody else in the past.
(ii) Telephone survey is the most suitable method of collecting data, when the population is literate and spread over a large area.
Ans: False
Explanation: A telephone survey is particularly suitable when respondents are reachable by phone and when literacy is not required, because the interviewer asks questions orally. It is also useful where the population is spread over a large area and in-person visits would be costly or time-consuming. If the population is literate and concentrated, written questionnaires may be preferable.
In a telephone survey, the investigator asks questions over the phone or mobile. There is no need for respondents to read a questionnaire. This method saves time when the population is widely spread.
(iii) Data collected by investigator is called the secondary data.
Ans: False
Explanation: Data collected directly by the investigator for the purpose of the current study are called primary data. Data that already exist and were collected earlier by someone else are called secondary data.
Primary data: collected by the investigator. Secondary data: already in existence, collected by other investigators earlier.
(iv) There is a certain bias involved in the non-random selection of samples.
Ans: True
Explanation: Non-random selection denies each unit of the population an equal chance of selection. This allows personal bias or systematic error to enter the sample selection process, making results less representative of the population.
Non-random selection obstructs the equal chance of every unit getting selected and may introduce the investigator's personal bias into the sample.
(v) Non-sampling errors can be minimised by taking large samples.
Ans: False
Explanation: Non-sampling errors arise from faulty data collection, recording mistakes, respondent misunderstanding, or biased questions. Increasing the sample size does not necessarily reduce such errors; in some cases larger samples can increase the chances of non-sampling errors unless collection procedures are improved and enumerators are properly trained.
Non-sampling errors relate to the process of collecting data. They may increase with larger surveys if care is not taken to control procedures and supervision.
Q4: What do you think about the following questions? Do you find any problem with these questions? If yes, how?
(i) How far do you live from the closest market?
Ans: This question is ambiguous. Respondents may be unsure whether to answer in metres, kilometres or time. A clearer version is:
How many kilometres is your home from the nearest market?
a) Less than 1 km
b) Between 1 km and 2 km
c) More than 2 km
(ii) If plastic bags are only 5 per cent of our garbage, should it be banned?
Ans: This question is leading and long; it may bias responses and discourage completion. A clearer, shorter version is:
Do you think the use of plastic bags should be banned?
a) Yes b) No
(iii) Wouldn't you be opposed to an increase in the price of petrol?
Ans: This question contains a negative and is leading. It can confuse respondents. A better version is:
Would you oppose an increase in the price of petrol?
(iv)
(a) Do you agree with the use of chemical fertilizers?
(b) Do you use fertilizers in your fields?
(c) What is the yield per hectare in your field?
Ans: The sequence should move from general factual to opinion questions. A better order is:
(a) What is the yield per hectare in your field?
(b) Do you use fertilisers in your fields?
(c) Do you agree with the use of chemical fertilisers?
Explanation: Questions should be simple, clear and arranged from specific factual items to opinion items, to avoid confusing or leading the respondent.
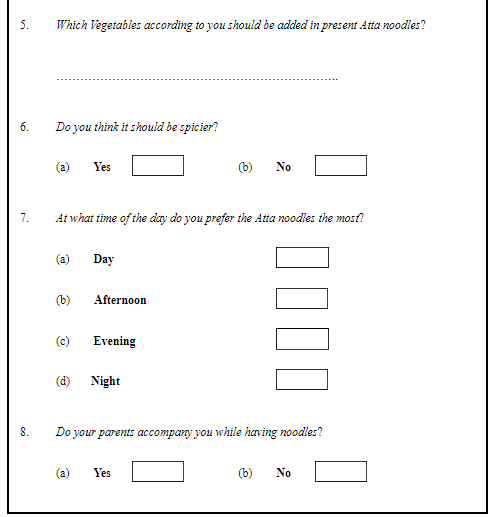
Q5: You want to research on the popularity of Vegetable Atta Noodles among children. Design a suitable questionnaire for collecting this information.
Ans: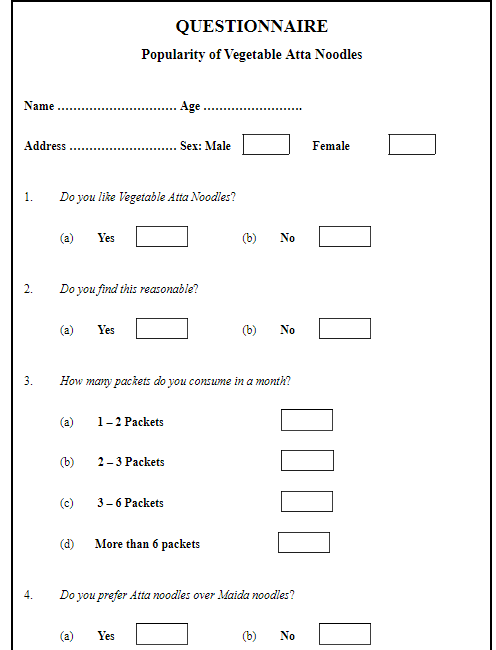
Q6: In a village of 200 farms, a study was conducted to find the cropping pattern. Out of the 50 farms surveyed, 50% grew only wheat. Identify the population and the sample here.
Ans: Population: 200 farms.
Sample: 50 farms (the subset selected from the population for the survey).
Explanation: The population is the complete group we want information about. The sample is the smaller number actually surveyed to draw conclusions about the population.
Q7: Give two examples each of sample, population and variable.
Ans: Sample: (1) 50 students selected from a school of 500 to measure heights. (2) 2,000 blood samples taken from 20,000 people to study average blood-sugar levels.
Population: (1) All 500 students in the school. (2) All 20,000 people from whom the sample could have been drawn.
Variable: (1) Height of students. (2) Blood-sugar level. Variables are characteristics that can be measured or expressed numerically, such as age, income, height or yield per hectare.
Q8: Which of the following methods give better results and why?
(a) Census
(b) Sample
Ans: The sample method gives better practical results in many situations for these reasons.
- Accuracy in practice: While a census examines every unit and is theoretically most accurate, in practice surveys of the entire population are harder to manage. In a sample, errors (if any) are easier to detect and correct because of the smaller size.
- Less time and effort: The sample method studies fewer units, saving time and reducing field effort.
- Cost efficient: Sampling is cheaper because fewer interviews or measurements are required.
- Lower non-sampling error risk: With a smaller, well-trained team, chances of data-collection mistakes and other non-sampling errors can be lower than in a large-scale census.
- More efficient supervision: Small teams can be trained and supervised better, improving data quality and consistency.
Q9: Which of the following errors is more serious and why?
(a) Sampling error
(b) Non-sampling error
Ans: Non-sampling error is more serious.
Explanation: Sampling error arises from observing a sample rather than the whole population and can be reduced by increasing sample size or using better sampling methods. Non-sampling errors (such as biased questions, recording mistakes, non-response, or misclassification) stem from flaws in the collection and processing of data and are harder to detect and correct. They may require repeating the survey or redesigning procedures to fix.
Q10: Suppose there are 10 students in your class. You want to select three out of them. How many samples are possible?
Ans:
Sol:
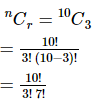
We need the number of ways to choose 3 students out of 10 (order does not matter).
Number of possible samples = C(10, 3) = (10 × 9 × 8) ÷ (3 × 2 × 1) = 720 ÷ 6 = 120.
Thus, 120 samples are possible in the above scenario.
Q11: Discuss how you would use the lottery method to select 3 students out of 10 in your class?
Ans: The following method can be used while selecting 3 students out of 10 in the class:
- Make ten paper slips of equal size.
- Write the name of each student on a separate slip.
- Ensure that no two slips contain the same name.
- Put all the slips in a box and mix them thoroughly.
- Draw three slips at random without replacement (one by one).
- The names on the three drawn slips are the selected students.
Q12: Does the lottery method always give you a random sample? Explain.
Ans: Yes, provided the procedure is carried out fairly.
Explanation: In the lottery method each unit has an equal chance of selection only if slips are prepared correctly, no names are omitted or duplicated, and the slips are well mixed before drawing. If these conditions hold, the lottery method produces a random sample because every student has the same probability of being chosen.
Q13: Explain the procedure of selecting a random sample of 3 students out of 10 in your class, by using random number tables.
Ans: Procedure:
- Assign two-digit numbers to the 10 students: 01, 02, ..., 10.
- Open a two-digit random number table at any point and read numbers either horizontally or vertically.
- Pick the first three distinct numbers between 01 and 10 that appear in the table. If a number repeats or lies outside 01-10, skip it and continue reading the table until you have three distinct valid numbers.
- The students whose assigned numbers match the three selected random numbers form the random sample.
Q14: Do samples provide better results than surveys? Give reasons for your answer.
Ans: Yes, samples often provide better practical results than a full survey (census) because:
- Reliable and accurate outputs: Errors are easier to find and correct in samples due to smaller size.
- Less time and energy: Studying fewer units saves time and reduces fieldwork.
- Cost efficient: Sampling reduces the cost of data collection.
- Lower non-sampling errors: Smaller studies with trained teams can reduce non-sampling mistakes.
- Efficient organisation: Small teams can be better trained and supervised, improving data quality.
- Feasible for large populations: When the population is vast or hard to reach, sampling is the practical choice.
FAQs on NCERT Solutions - Collection of Data
| 1. What is the importance of collecting data in research? |  |
| 2. What are the different methods of data collection? | |
| 3. How do you ensure the reliability and validity of collected data? | |
| 4. What are primary and secondary data? | |
| 5. What role does technology play in data collection? | |


