NCERT Solutions - Organisation of Data

Q1: Which of the following alternatives is true?
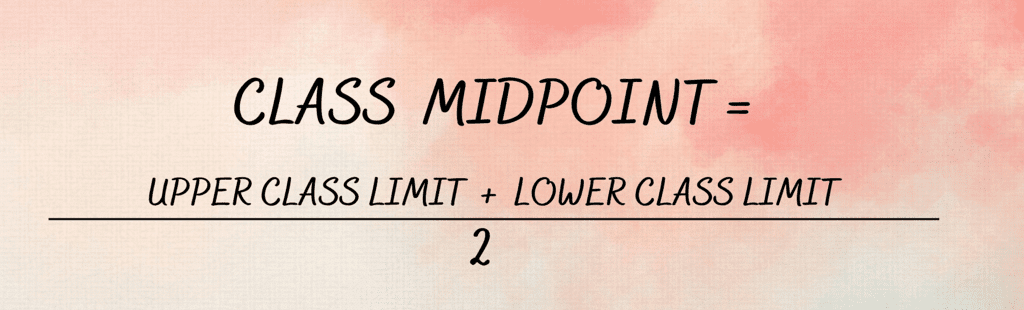
(i) The class midpoint is equal to:
(a) The average of the upper-class limit and the lower-class limit.
(b) The product of the upper-class limit and the lower-class limit.
(c) The ratio of the upper-class limit and the lower-class limit.
(d) None of the above.
Ans: (a)
The class midpoint, also known as class mark, is equal to the average of the upper class limit and the lower class limit. It is known by adding the values of upper and lower limits and dividing the total by 2.
(ii) The frequency distribution of two variables is known as
(a) Univariate Distribution
(b) Bivariate Distribution
(c) Multivariate Distribution
(d) None of the above
Ans: (b)
The frequency distribution of two variables is known as Bivariate Frequency Distribution. For example, the joint distribution of household income and household expenditure is a bivariate frequency distribution because it records frequencies for pairs of values (income, expenditure).
(iii) Statistical calculations in classified data are based on
(a) the actual values of observations
(b) the upper-class limits
(c) the lower class limits
(d) the class midpoints
Ans: (d)
The calculations in classified data or continuous series are usually based on the class midpoints (class marks). Since individual observations are grouped, we use the midpoint of each class as the representative value for that class when computing measures such as mean or variance.
(iv) Range is the
(a) difference between the largest and the smallest observations
(b) difference between the smallest and the largest observations
(c) average of the largest and the smallest observations
(d) the ratio of the largest to the smallest observation
Ans: (a)
The range is defined as the difference between the largest and the smallest observations in the data set. It measures the spread or dispersion in the simplest way.
Algebraically,
R = H - L
Where,
R denotes range
H is the highest value
L is the lowest value
Q2: Can there be any advantage in classifying things? Explain with an example from your daily life.
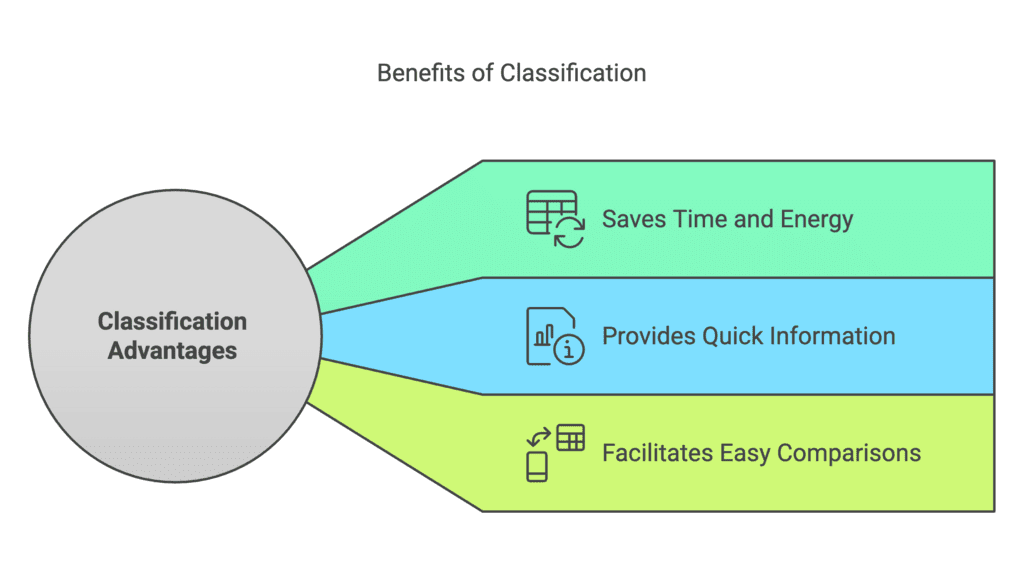
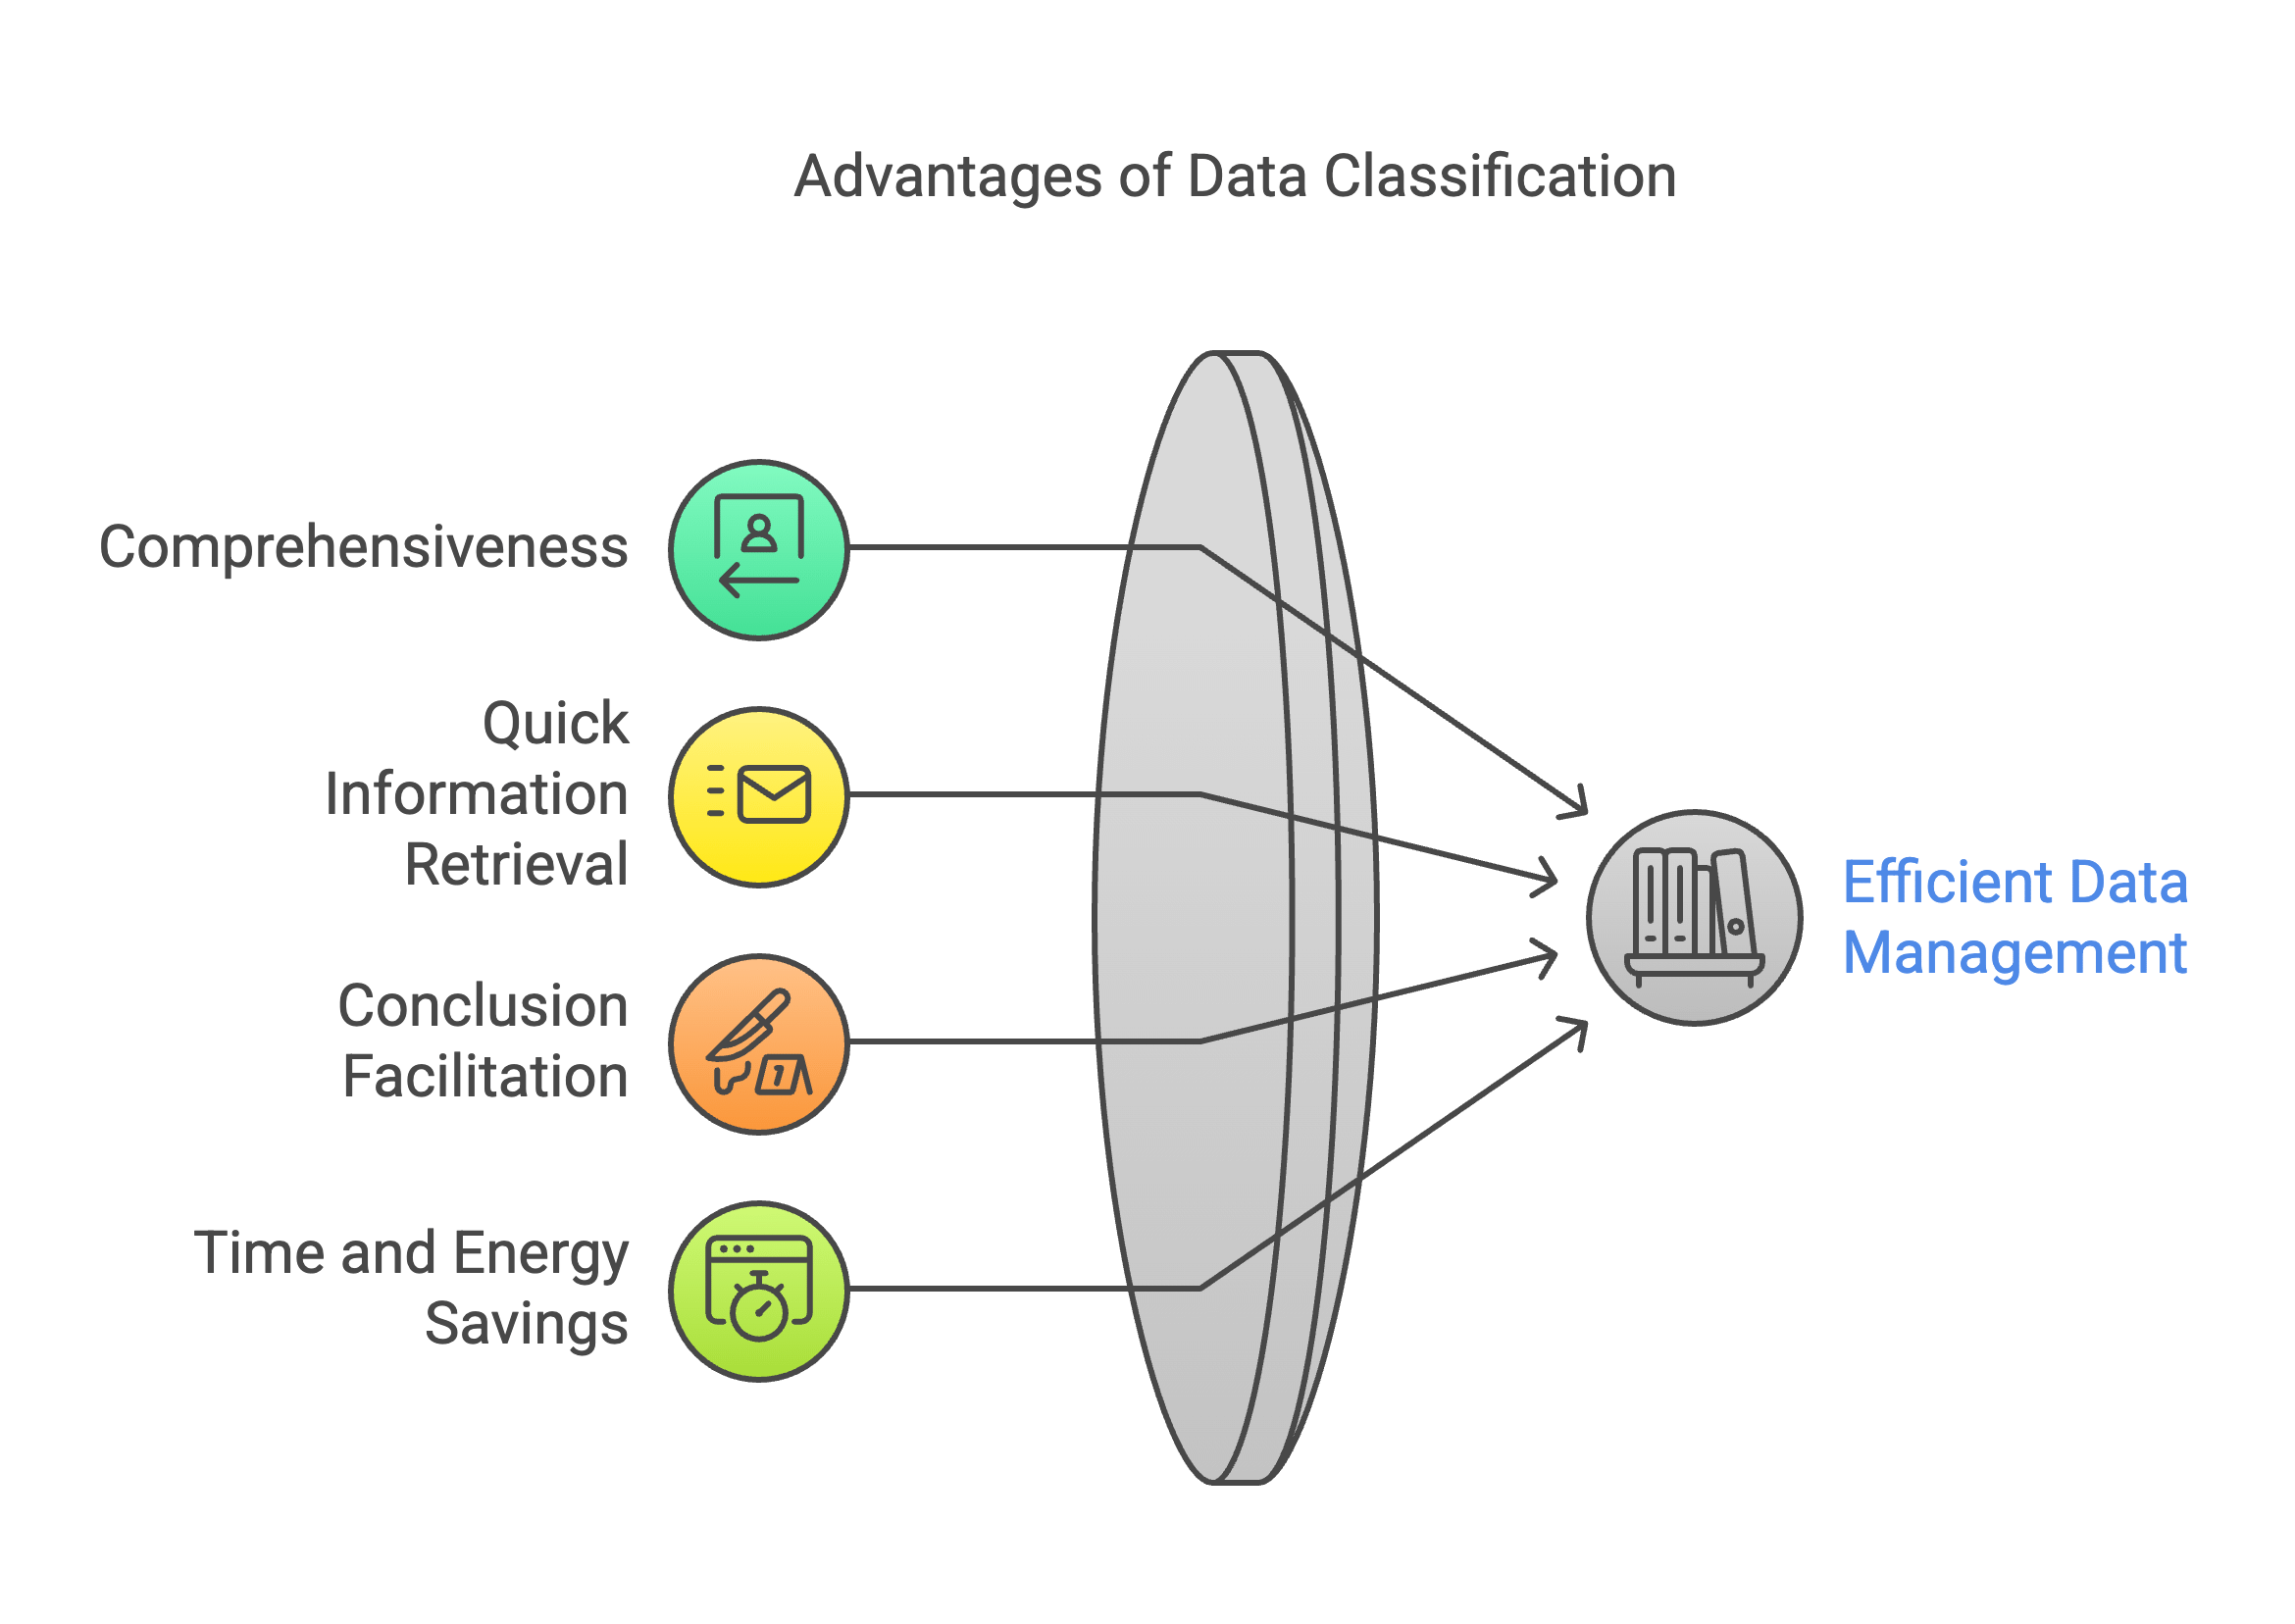
Ans: Yes, there are many advantages to classifying things. The following are the advantages associated with classification:
- Saves Time and Energy - Classification of things not only saves our time but also our energy which would otherwise be utilised in searching for individual items.
- Quick Information - Information can be easily collected from classified things.
- Easy Comparison and Conclusions - Classification facilitates comparisons and helps in drawing fast conclusions or inferences.
The advantage of classification can be better understood with a daily life example. A post office sorts letters and then classifies them according to various attributes - first by state, then by city and street. This classification helps the postman to deliver letters quickly and efficiently.
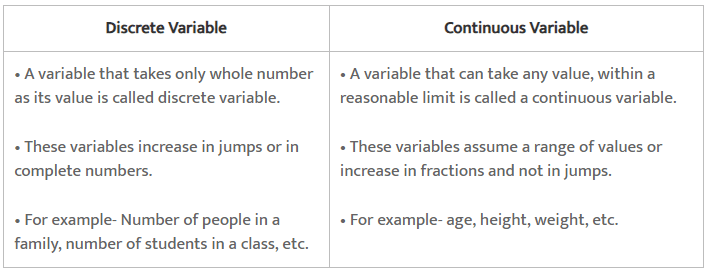
 Q3: What is a variable? Distinguish between a discrete and a continuous variable.
Ans: A measurable characteristic whose value changes over time is called a variable. It refers to that quantity that keeps on changing and which can be measured by some unit. For example, if we measure the height of students in a class, then the height is regarded as a variable. A variable can be either discrete or continuous.
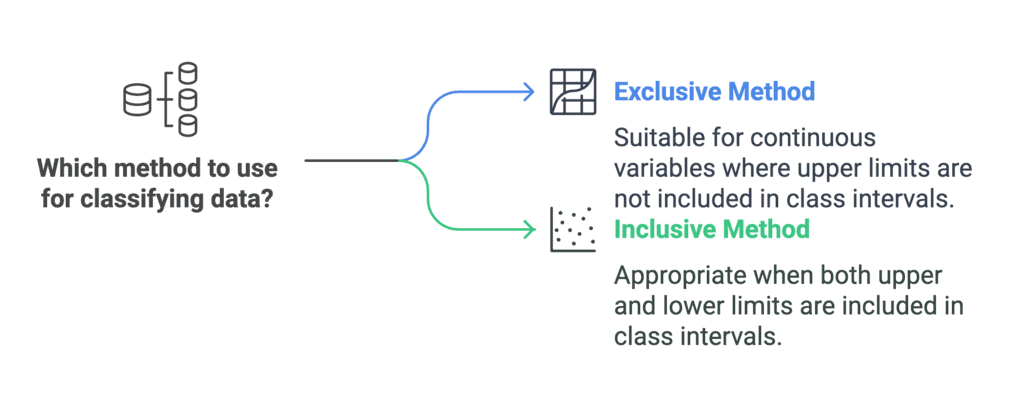
Q4: Explain the 'exclusive' and 'inclusive' methods used in the classification of data.
Ans:
- Exclusive Method - In this method the upper limit of one class becomes the lower limit of the next class, for example 0-10, 10-20, 20-30. The upper limit is excluded from the class but the lower limit is included. This is appropriate for continuous variables when class boundaries are handled using conventions (e.g. 0-9.999..., 10-19.999...).
- Inclusive Method - Here the classes are formed so that the upper limit of a class does not repeat as the lower limit of the next class, for example 1-5, 6-10, 11-15. Both limits are included in the class interval. This method is often used for discrete data where class endpoints are integer counts.
Q5: Use the data in Table 3.2 that relate to monthly household expenditure (in Rs) on food of 50 households and obtain the range of monthly household expenditure on food.
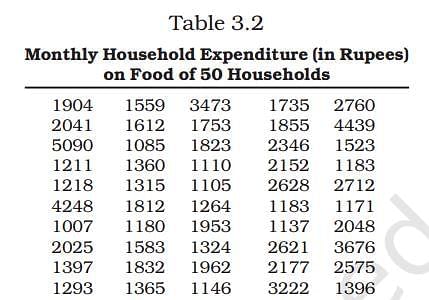 (i) Obtain the range of monthly household expenditure on food.
Ans:
Calculation of Range
Range = Highest Value - Lowest Value
Highest Value = 5090
Lowest Value = 1007
So, Range = 5090 - 1007 = 4083
(ii) Divide the range into an appropriate number of class intervals and obtain the frequency distribution of expenditure.
Ans: Preparing Tally Marks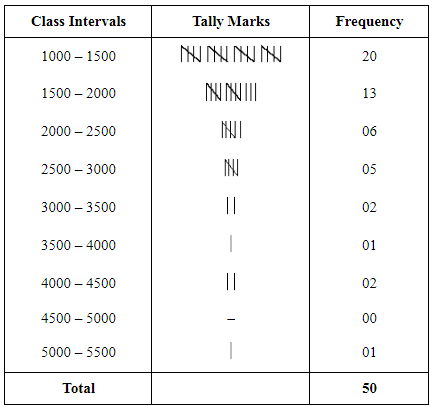
(iii) Find the number of households whose monthly expenditure on food is
(a) less than Rs 2000
(b) more than Rs 3000
(c) between Rs 1500 and Rs 2500
Ans:
a) Number of households whose monthly expenditure on food is less than Rs 2000
= 20 + 13 = 33
b) Number of households whose monthly expenditure on food is more than Rs 3000
= 2 + 1 + 2 + 0 + 1 = 6
c) Number of households whose monthly expenditure on food is between Rs 1500 and Rs 2500
= 13 + 6 = 19
Q6: In a city, 45 families were surveyed for the number of domestic appliances they used. Prepare a frequency array based on their replies as recorded below.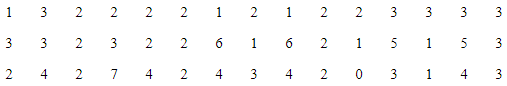 Ans: Frequency Array of appliances being used by households
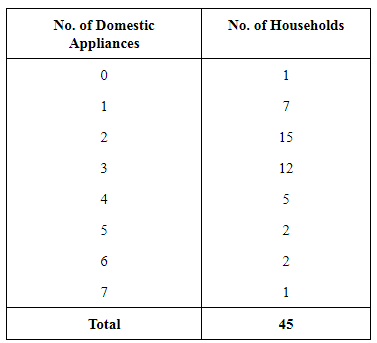
Q7: What is 'loss of information' in classified data?
Ans: 'Loss of information' is a major drawback of the classified data. The classification or grouping of raw data into classes makes it more concise and understandable. But simultaneously there exists a loss of information. The calculations involved in the classified data or the continuous series are based on the class midpoints. The items in such series cannot be exactly measured and consequently, an individual observation loses its importance during the statistical calculations. Further, the statistical calculations are based on the values of the class marks, ignoring the exact observations of the data leading to the problem of loss of information.
Q8: Do you agree that classified data is better than raw data?
Ans: The classified data has the following advantages over the raw data.
- Comprehensive - Raw data can be large and tangled, whereas classified data are compact and easier to handle.
- Quick Information - It is troublesome to pick up information from unclassified data. Information can be easily collected from the classified data.
- Better Comparisons and Conclusions - Classification facilitates comparisons and helps in drawing fast conclusions or inferences.
- Saves Time and Energy - Classified data saves time and energy which would otherwise be spent searching through raw data.
Q9: Distinguish between Univariate and Bivariate frequency distribution.
Ans:
- The frequency distribution of a single variable is called a Univariate Distribution. The income of people, marks scored by students, etc. are examples of Univariate Distribution.
- The frequency distribution of two variables is called Bivariate Distribution. Examples include weight and height of individuals, or sales and advertisement expenditure recorded together.
Q10: Prepare a frequency distribution by inclusive method taking a class interval of 7 from the following data: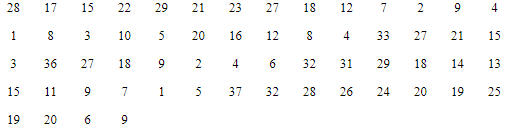
Ans: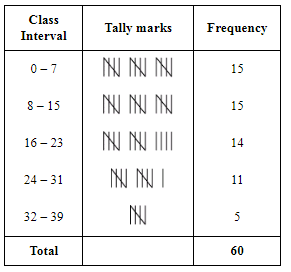
Q11: "The quick brown fox jumps over the lazy dog"
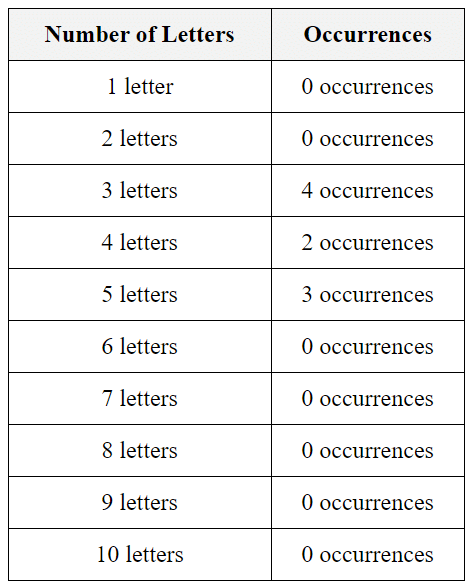
Examine the above sentence carefully and note the number of letters in each word. Treating the number of letters as a variable, prepare a frequency array for this data.
Ans: To prepare a frequency array for the number of letters in each word in the sentence "The quick brown fox jumps over the lazy dog", count letters in each word and record frequencies. This is an example of treating a linguistic property as a quantitative variable.
- "The" has 3 letters
- "quick" has 5 letters
- "brown" has 5 letters
- "fox" has 3 letters
- "jumps" has 5 letters
- "over" has 4 letters
- "the" has 3 letters
- "lazy" has 4 letters
- "dog" has 3 letters
Frequency Array:
FAQs on NCERT Solutions - Organisation of Data
| 1. What is the importance of data organization in commerce? |  |
| 2. What are the common methods of organizing data in commerce? | |
| 3. How can technology aid in the organization of data for businesses? | |
| 4. What role does data analysis play in the organization of data? | |
| 5. What challenges do businesses face in organizing data? | |


