NCERT Solutions - Correlation

Q1: The unit of correlation coefficient between height in feet and weight in kgs is
(i) kg/feet
(ii) percentage
(iii) non-existent
Ans: (iii)
Explanation: The correlation coefficient is a ratio of covariance to the product of standard deviations of the two variables. Because the units in the numerator and denominator cancel out, the coefficient is dimensionless. Therefore it has no unit, and option (iii) is correct. Options (i) and (ii) are incorrect because the coefficient is neither expressed in kg/feet nor in percent.
Q2: The range of simple correlation coefficient is
(i) 0 to infinity
(ii) minus one to plus one
(iii) minus infinity to infinity
Ans: (ii)
Explanation: The simple (Pearson) correlation coefficient r always lies between -1 and +1, i.e. -1 ≤ r ≤ +1. A value of +1 indicates perfect positive linear relationship, -1 indicates perfect negative linear relationship, and 0 indicates no linear relationship. Options (i) and (iii) are therefore incorrect.
Q3: If rxy is positive the relation between X and Y is of the type
(i) When Y increases X increases
(ii) When Y decreases X increases
(iii) When Y increases X does not change
Ans:
Ans: (i)
Explanation: A positive value of rxy means X and Y move in the same direction. So when Y increases, X tends to increase and when Y decreases, X tends to decrease. Option (ii) describes an inverse relationship and option (iii) implies no relation, both of which conflict with a positive r.
Q4: If rxy = 0 the variable X and Y are
(i) linearly related
(ii) not linearly related
(iii) independent
Ans:
Ans: (ii)
Explanation: rxy = 0 indicates no linear relationship between X and Y. It does not necessarily mean the variables are independent; they could be related by a non-linear pattern. Hence (ii) is correct; (iii) is not implied by r = 0.
Q5: Of the following three measures which can measure any type of relationship
(i) Karl Pearson's coefficient of correlation
(ii) Spearman's rank correlation
(iii) Scatter diagram
Ans:
Ans: (iii)
Explanation: A scatter diagram is a graphical tool that can display any form of relationship - linear or non-linear - between two variables, so it can reveal patterns that numerical coefficients may miss. Karl Pearson's coefficient measures the strength of linear association only. Spearman's rank correlation is suited to ordinal (ranked) data and is less sensitive to the exact numerical values; it detects monotonic relationships but not every form of association. Thus the scatter diagram is the most general tool among the three.
Q6: If precisely measured data are available the simple correlation coefficient is
(i) more accurate than rank correlation coefficient
(ii) less accurate than rank correlation coefficient
(iii) as accurate as the rank correlation coefficient
Ans:
Ans: (i)
Explanation: When accurate numerical measurements are available, Pearson's (simple) correlation coefficient uses the full quantitative information and is generally more precise for measuring linear association than rank correlation. Rank correlation converts data to ranks and thus loses some information; it is, however, useful when data are ordinal or contain extreme outliers. If the data are perfectly linear and without measurement issues, both methods can give similar results, but in general (i) is correct.
Q7: Why is r preferred to covariance as a measure of association?
Ans: Although the correlation coefficient and covariance both measure the direction of linear association, r is preferred because:
- r is dimensionless and ranges between -1 and +1, which makes its magnitude easy to interpret.
- r is scale-free, so it allows comparison across different datasets or variables measured in different units.
- Covariance depends on the units of the variables and therefore is not directly comparable across situations.
Q8: Can r lie outside the -1 and 1 range depending on the type of data?
Ans: No. The value of r cannot lie outside the range -1 to +1. If a calculated value falls outside this range, it indicates an error in computation. r = -1 denotes perfect negative linear correlation and r = +1 denotes perfect positive linear correlation.
Q9: Does correlation imply causation?
Ans: No. Correlation indicates that two variables move together in some way, but it does not establish that one variable causes the other to change. There may be a third factor causing both changes, or the association may be coincidental. Causation requires further evidence beyond correlation.
Q10: When is rank correlation more precise than simple correlation coefficient?
Ans: The rank correlation method is more appropriate (and often more reliable) than the simple correlation coefficient when:
- Variables are ordinal (only ranks or preferences are available).
- The data contain extreme values (outliers) which may distort Pearson's coefficient.
In such cases rank correlation better reflects the strength of the monotonic relationship.
Q11: Does zero correlation mean independence?
Ans: No. r = 0 means there is no linear relationship between the variables. But the variables may still be related by a non-linear function. Therefore zero correlation does not imply statistical independence.
Q12: Can a simple correlation coefficient measure any type of relationship?
Ans: No. The simple correlation coefficient measures only the strength and direction of a linear relationship between two variables. It is not suitable for detecting non-linear relationships such as quadratic or other curvilinear associations.
Q13: Collect the price of five vegetables from your local market every day for a week. Calculate their correlation coefficients. Interpret the result.
Ans: The task is a practical exercise requiring data collection and pairwise computation of correlation coefficients for the vegetable prices. This exercise involves multiple variables and is beyond the worked examples provided here; carry out the data collection, compute Pearson's r for each pair of vegetables, and interpret whether prices move together (positive r), move in opposite directions (negative r), or show little linear association (r near 0).
Q14: Measure the height of your classmates. Ask them the height of their benchmate. Calculate the correlation coefficient of these two variables. Interpret the result.
Ans:


The images above indicate where to record measurements. After measuring, compute the correlation coefficient using the standard formula. Interpret the value of r as showing positive, negative or no linear association between a student's height and the benchmate's height.
Q15: List some variables where accurate measurement is difficult.
Ans: The following are some variables where accurate measurement is difficult.
- Temperature and number of people falling ill.
- Change in temperature with the height of a mountain.
- Low rainfall and agricultural productivity
- High population growth and degree of poverty
- Number of tourists and change in the political atmosphere in India.
Q16: Interpret the values of r as 1, -1 and 0.
Ans: r = 1 indicates a perfect positive linear correlation: as one variable increases the other increases proportionately. r = -1 indicates a perfect negative linear correlation: as one variable increases the other decreases proportionately. r = 0 indicates no linear correlation; however, a non-linear relationship may still exist.
Q17: Why does the rank correlation coefficient differ from the Pearsonian correlation coefficient?
Ans: They differ because of how they treat data:
- Pearson's coefficient uses actual numerical values and measures linear association; it is sensitive to the magnitude of differences and to outliers.
- Rank correlation converts data to ranks and measures the strength of a monotonic relationship; it is less affected by outliers and is suitable for ordinal data. Because ranking discards some quantitative information, the rank correlation value is often lower than or equal to the Pearsonian value unless the relationship is perfectly monotonic and measured without error.
Q18: Calculate the correlation coefficient between the heights of fathers in inches (X) and their sons (Y)
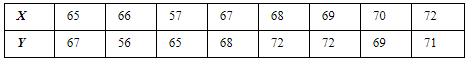
Ans:


Q19: Calculate the correlation coefficient between X and Y and comment on their relationship.
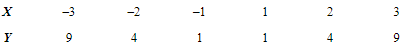
Ans:


Comment: As the value of r is zero, there is no linear correlation between X and Y. This does not rule out the possibility of a non-linear relationship.
Q20: Calculate the correlation coefficient between X and Y and comment on their relationship
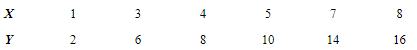
Ans:


Comment: As the correlation coefficient between the two variables is +1, the two variables are perfectly positively correlated; one variable increases proportionately as the other increases.
FAQs on NCERT Solutions - Correlation
| 1. What is correlation in statistics? |  |
| 2. How is correlation calculated? | |
| 3. What does a correlation coefficient of 0 indicate? | |
| 4. Can correlation imply causation? | |
| 5. How is the strength of correlation interpreted? | |


