Ideal Gas Laws & their Graphical Representation | Physical Chemistry PDF Download

Introduction
The three fundamental gas laws discover the relationship of pressure, temperature, volume and amount of gas. Boyle's Law tells us that the volume of gas increases as the pressure decreases. Charles' Law tells us that the volume of gas increases as the temperature increases. And Avogadro's Law tell us that the volume of gas increases as the amount of gas increases. The ideal gas law is the combination of the three simple gas laws.
Ideal Gases
Ideal gas, or perfect gas, is the theoretical substance that helps establish the relationship of four gas variables, pressure (P), volume (V), the amount of gas (n) and temperature(T). It has characters described as follow:
- The particles in the gas are extremely small, so the gas does not occupy any spaces.
- The ideal gas has constant, random and straight-line motion.
- No forces between the particles of the gas. Particles only collide elastically with each other and with the walls of container.
Real Gases
Real gas, in contrast, has real volume and the collision of the particles is not elastic, because there are attractive forces between particles. As a result, the volume of real gas is much larger than of the ideal gas, and the pressure of real gas is lower than of ideal gas.
All real gases tend to perform ideal gas behavior at low pressure and relatively high temperature. Real gas effects include those adjustments made to account for a greater range of gas behavior:
· Compressibility effects (Z allowed to vary from 1.0)
· Variable heat capacity (specific heats vary with temperature)
· Vander Waals forces (related to compressibility, can substitute other equations of state)
The compressibility factor (Z) tells us how much the real gases differ from ideal gas behavior.
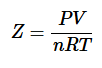
For ideal gases, Z=1, For real gases, Z≠1.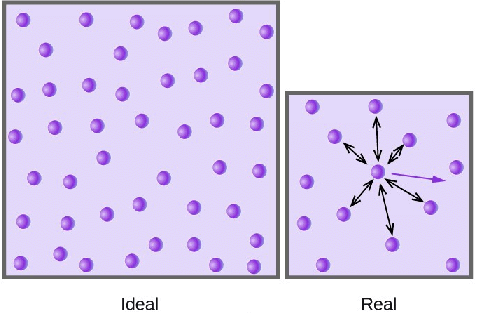
Experimentally derived gas laws
Relationship between various parameter of the gas. Gaseous state is the only state that allows a quantitative description between the four parameters, P, V, T & n. The relationship which connects the four variables is known as equation of state, which can be obtained experimentally from the following gas laws.
1. Boyle’s law (Robert Boyle, 1662)
- Boyle's Law was perhaps the first expression of an equation of state.
- In 1662 Robert Boyle performed a series of experiments employing a J-shaped glass tube, which was sealed on one end.
- Mercury was added to the tube, trapping a fixed quantity of air in the short, sealed end of the tube.
- Then the volume of gas was carefully measured as additional mercury was added to the tube.
- The pressure of the gas could be determined by the difference between the mercury level in the short end of the tube and that in the long, open end.
- The image of Boyle's Equipment shows some of the exotic tools used by Boyle during his study of gases.
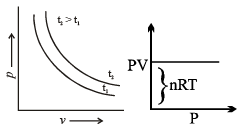
- Through these experiments, Boyle noted that the pressure exerted by a gas held at a constant temperature varies inversely with the volume of the gas.
- For example, if the volume is halved, the pressure is doubled; and if the volume is doubled, the pressure is halved.
- Given the inverse relationship between pressure and volume, the product of pressure (P) and volume (V) is a constant (k) for a given mass of confined gas as long as the temperature is constant.
- Stated as a formula, thus is: P ∝ 1/V or PV = constant (K) or P1V1 = P2V2.
Graphical Analysis: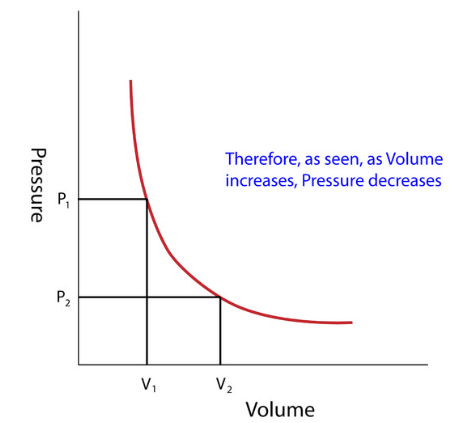
2. Charle’s law (Jacques Charle’s 1987)
- In 1787, the French physicist and balloon pioneer, Jacques Charles, found that oxygen, nitrogen, hydrogen, carbon dioxide, and air expand to the same extent over the same 80 kelvin interval.
- He noted that, for an ideal gas at constant pressure, the volume is directly proportional to its temperature
- The volume of a given mass of a gas at constant pressure increases or decreases by 1/273 of its volume at 0°C for each degree rise or fall of temperature.
- The volume of a fixed mass of the gas at constant pressure is directly proportional to its temperature in Kelvin.
- Mathematical representation: At constant pressure (P) and fixed number of moles (n)
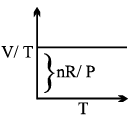
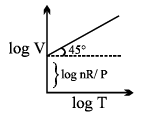
- V ∝ T or V/T = constant (K)

- The value of K depends upon mass, pressure and nature of gas.
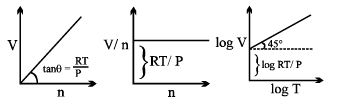
Graphical Analysis:
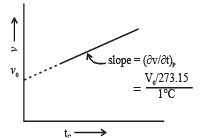
The law can be represented by plotting V vs T at constant pressure. Such plot is called isobar.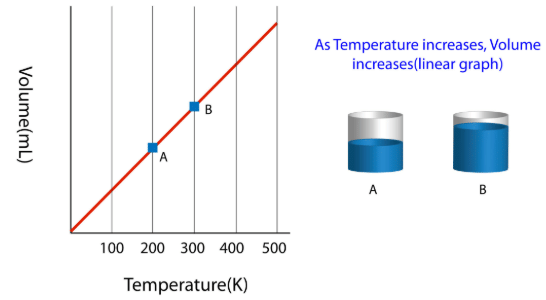
The volume of the gas is a linear function of the temperature.
Vt = a + bt
3. Gay-Lussac’s Law
- In 1802, Joseph Louis Gay-Lussac published results of similar, though more extensive experiments.
- GayLussac credited Charles' earlier work by naming the law in his honor.
- Gay-Lussac himself is credited with the law describing pressure, which he found in 1809. It states that the pressure exerted on a container's sides by an ideal gas is proportional to its temperature.
Graphical Analysis: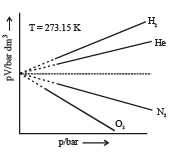
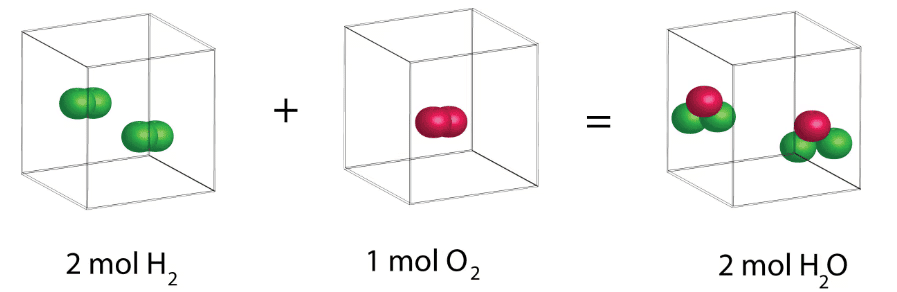
4. Avogadro’s law
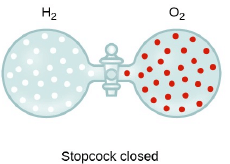
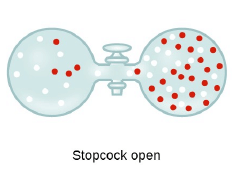
- According to Avogadro’s law, equal number of molecules of different gases under identical conditions of temperature and pressure occupy the same volume.
- Whether the molecules are heavy (e.g. Br2) or light (e.g. H2) gases with equal number of molecules would occupy the same volume.
- This leads to one of the most important features of gases that the distance between molecules is much larger than the actual dimensions of molecules, since otherwise, Avogadro’s law would not have been true.
Graphical Analysis:
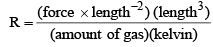
Universal Gas constant
R = PV/nT
Physical Significance of Gas constant R:
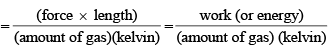
Value of Gas Constant in SI units:
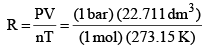 = 0.083 14 bar dm3 K–1 mol–1
The gas constant(R) in various units
8.31451 J K-1 mol-1
8.20578 x 10⁻² l atm K-1 mol-1
8.31451 x 10⁻² L bar K-1 mol-1
8.31451 Pa m3 K-1 mol-1
62.364 L Torr K-1 mol-1
1.98722 cal K-1 mol-1
Concepts of Partial Pressure and Partial Volume
According to Dalton’s law of partial pressure, the total pressure of a mixture of gases is equal to the sum of the partial pressure of the constituent gases.
Partial Pressure in a Gaseous Mixture
Let a mixture of gases have the amount n1 of the first gas, n2 of the second gas and so on. Let the corresponding partial pressures be p1, p2, ..... The total pressure is given by:
Ptotal = P1 + P2 + ....
If the gases present in the mixture behave ideally, then it is possible to write separately for each gas,
P1V = n1RT ....(1a)
P2V = n2RT ...(1b)
Hence (P1 + P2 + ....) V = (n1 + n2 + ....) RT
i.e. PtotalV = ntotalRT ...(2)
where ntotal is the total amount of gases in the mixture. Dividing eqs (1a) and (1b) by Eq. (2). we get
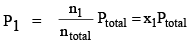 ..(3a)
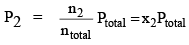 ...(3b)
Graham’s Law of Diffusion & Effusion
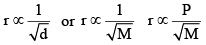
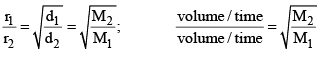
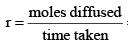
The rate of diffusion (or effusion) of a gas is inversely proportional to the square root of its density or molar mass.

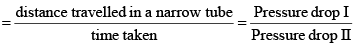
Mathematically:
 [For gases effusing at different pressures]
Where ‘r’ is rate of diffusion of any gas.
 d is density at some temperature.
Ideal Gas Law
The ideal gas law is the combination of the three simple gas laws. By setting all three laws directly or inversely proportional to Volume, you get:
Next replacing the directly proportional to sign with a constant(R) you get:
And finally get the equation:


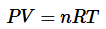
where Pis the absolute pressure of ideal gas
- V is the volume of ideal gas
- n is the amount of gas
- T is the absolute temperature
- R is the gas constant
Here, R is the called the gas constant. The value of R is determined by experimental results and its numerical value changes with units.
|
84 videos|142 docs|67 tests
|
FAQs on Ideal Gas Laws & their Graphical Representation - Physical Chemistry
| 1. What are the ideal gas laws? |  |
| 2. How are the ideal gas laws represented graphically? | |
| 3. What is Boyle's law and how is it represented graphically? | |
| 4. What is Charles's law and how is it represented graphically? | |
| 5. What is Avogadro's law and how is it represented graphically? | |


video lectures
,Important questions
,Previous Year Questions with Solutions
,Exam
,shortcuts and tricks
,Viva Questions
,study material
,Extra Questions
,Semester Notes
,MCQs
,Summary
,mock tests for examination
,Ideal Gas Laws & their Graphical Representation | Physical Chemistry
,Sample Paper
,Ideal Gas Laws & their Graphical Representation | Physical Chemistry
,Objective type Questions
,past year papers
,practice quizzes
,ppt
,Free
,Ideal Gas Laws & their Graphical Representation | Physical Chemistry
;


Ideal Gas Laws & their Graphical Representation Free PDF Download
Importance of Ideal Gas Laws & their Graphical Representation
Ideal Gas Laws & their Graphical Representation Notes
Ideal Gas Laws & their Graphical Representation Chemistry Questions
Study Ideal Gas Laws & their Graphical Representation on the App
|
© EduRev
|
Education Revolution
|


|


