Ex-7.6 Statistics, Class 10, Maths RD Sharma Solutions | Extra Documents, Videos & Tests for Class 10 PDF Download
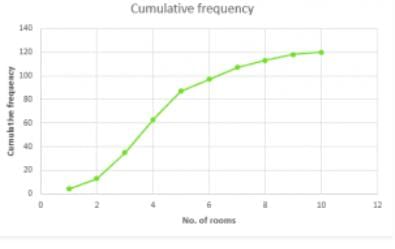
Q.1 Draw an ogive by less than the method for the following data:
| No. of rooms | No. of houses |
1 2 3 4 5 6 7 8 9 10 | 4 9 22 28 24 12 8 6 5 2 |
Sol :
| No. of rooms | No. of houses | Cumulative Frequency |
Less than or equal to 1 Less than or equal to 2 Less than or equal to 3 Less than or equal to 4 Less than or equal to 5 Less than or equal to 6 Less than or equal to 7 Less than or equal to 8 Less than or equal to 9 Less than or equal to 10 | 4 9 22 28 24 12 8 6 5 2 | 4 13 35 63 87 97 107 113 118 120 |
We need to plot the points (1,4) , (2,3) , (3,35) , (4,63) , (5,87) , (6,99) , (7,107) , (8,113) , (9,118) , (10,120), by taking upper class limit over the x-axis and cumulative frequency over the y-axis.
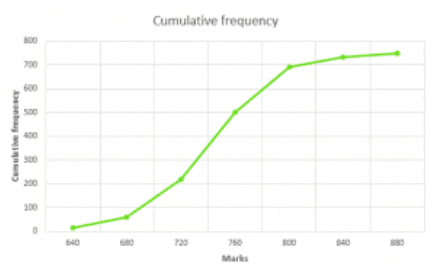
Q.2): The marks scored by 750 students in an examination are given in the form of a frequency distribution table:
| Marks | No. of Students |
600-640 640-680 680-720 720-760 760-800 800-840 840-880 | 16 45 156 284 172 59 18 |
Sol :
| Marks | No. of Students | Marks less than | Cumulative Frequency |
600-640 640-680 680-720 720-760 760-800 800-840 840-880 | 16 45 156 284 172 59 18 | 640 680 720 760 800 840 880 | 16 61 217 501 693 732 750 |
Plot the points (640-16), (680, 61), (720,217), (760,501), (800,673), (840,732), (880,750) by taking upper class limit over the x-axis and cumulative frequency over the y-axis.
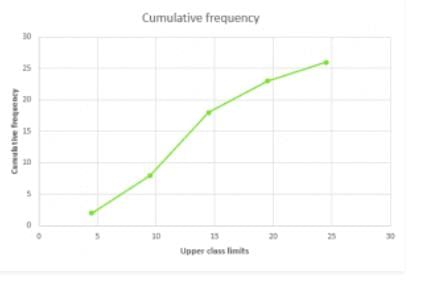
Q.3) Draw an ogive to represent the following frequency distribution:
| Class-interval | 0-4 | 5-9 | 10-14 | 15-19 | 20-24 |
| No. of students | 2 | 6 | 10 | 5 | 3 |
Sol :
The given frequency distribution is not continuous, so we will first make it continuous and then prepare the cumulative frequency:
| Class-interval | No. of Students | Less than | Cumulative frequency |
0.5-4.5 4.5-9.5 9.5-14.5 14.5-19.5 19.5-24.5 | 2 6 10 5 3 | 4.5 9.5 14.5 19.5 24.5 | 2 8 18 23 26 |
Plot the points (4.5, 2), (9.5, 8), (14.5, 18), (19.5, 23), (24.5,26) by taking the upper class limit over the x-axis and cumulative frequency over the y-axis.
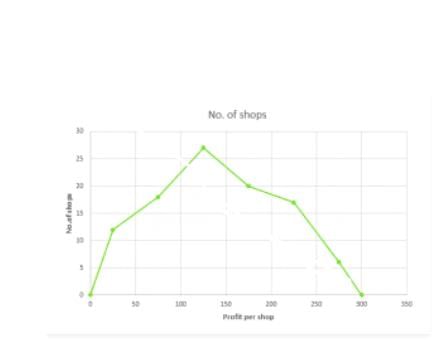
Q.4) The monthly profits (in Rs) of 100 shops are distributed as follows:
| Profits per shop: | 0-50 50-100 100-150 150-200 200-250 250-300 |
| No of shops: | 12 18 27 20 17 6 |
Draw the frequency polygon for it
Sol :
We have
| Profit per shop | Mid-value | No. of shops |
Less than 0 0-60 60-120 120-180 180-240 240-300 300-360 Above 300 | 0 25 75 125 175 225 275 300 | 0 12 18 27 20 17 6 0 |
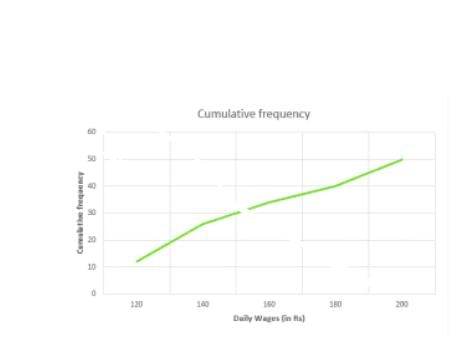
Q.5) The following distribution gives the daily income of 50 workers of a factory:
| Daily income (in Rs): | 100-120 120-140 140-160 160-180 180-200 |
| No of workers: | 12 14 8 6 10 |
Convert the above distribution to a ‘less than’ type cumulative frequency distribution and draw its ogive.
Sol :
We first prepare the cumulative frequency table by less than method as given below
| Daily income | Cumulative frequency |
| <120 | 12 |
| <140 | 26 |
| <160 | 34 |
| <180 | 40 |
| <200 | 50 |
Now we mark on x-axis upper class limit, y-axis cumulative frequencies.
Thus we plot the point (120,12)(140,26)(160,34)(180,40)(200,50).
Q.6) The following table gives production yield per hectare of wheat of 100 farms of a village:
| Production yield: | 50-55 55-60 60-65 65-70 70-75 75-80 in kg per hectare |
| No of farms: | 2 8 12 24 38 16 |
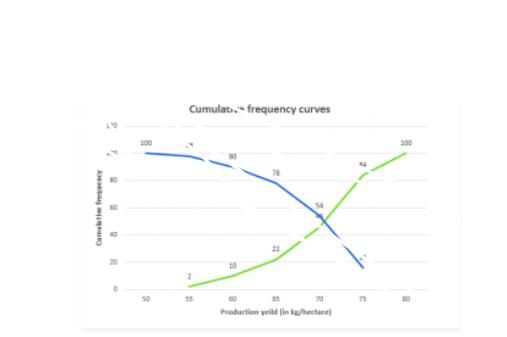
Draw ‘less than’ ogive and ‘more than’ ogive
Sol :
Less than method:
Cumulative frequency table by less than method
| Production yield | Number of farms | Production yield more than | Cumulative frequency |
| 50-55 | 2 | 55 | 2 |
| 55-60 | 8 | 60 | 10 |
| 60-65 | 12 | 65 | 22 |
| 65-70 | 24 | 70 | 46 |
| 70-80 | 38 | 75 | 84 |
| 75-80 | 16 | 80 | 100 |
Now we mark on x-axis upper class limit, y-axis cumulative frequencies.
We plot the point (50,100) (55, 98) (60, 90) (65, 78) (70, 54) (75, 16)
Q.7)During the medical check-up of 35 students of a class, their weight recorded as follows:
| Weight (in kg) | No of students |
| Less than 38 | 0 |
| Less than 40 | 3 |
| Less than 42 | 5 |
| Less than 44 | 9 |
| Less than 46 | 14 |
| Less than 48 | 28 |
| Less than 50 | 32 |
| Less than 52 | 35 |
Draw a less than type ogive for the given data. Hence, obtain the median weight from the graph and verify the verify the result my using the formula.
Sol : Less than method
It is given that
On x-axis upper class limits. Y-axis cumulative frequency
We plot the points (38,0) (40,3)(42,5)(44,9)(46,4)(48,28)(50,32)(52,35)
More than method: cumulative frequency
| Weight | No. of students | Weight more than | Cumulative frequency |
| 38-40 | 3 | 38 | 34 |
| 40-42 | 2 | 40 | 32 |
| 42-44 | 4 | 42 | 30 |
| 44-46 | 5 | 44 | 26 |
| 46-48 | 14 | 46 | 21 |
| 48-50 | 4 | 48 | 7 |
| 50-52 | 3 | 50 | 3 |
X-axis lower class limits on y-axis cf
We plot the points (38,35)(40,32)(42,30)(44,26)(46,26)(48,7)(50,3)
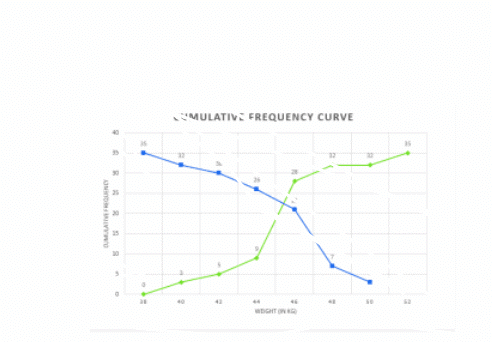
We find the two types of curves intersect at a point P. From point P perpendicular PM is draw on x-axis
The verification,
We have
| Weight (in kg) | No. of students | Cumulative frequency |
| 36-38 | 0 | 0 |
| 38-40 | 3 | 3 |
| 40-42 | 2 | 5 |
| 42-44 | 4 | 9 |
| 44-46 | 5 | 28 |
| 46-48 | 14 | 32 |
| 48-50 | 4 | 32 |
| 50-0 | 3 | 35 |
Now, N = 35
N2=17.5
The cumulative frequency just greater than N2 is 28 and the corresponding class is 46 – 48
Thus 46 – 48 is the median class such that
L = 46, f = 14, C1=14 h = 2
Median = 

= 46 +7/14
46.5
Median = 46.5 kg
Hence verified
Q.9) The following table shows the height of trees:
| Height | No. of trees |
Less than 7 Less than 14 Less than 21 Less than 28 Less than 35 Less than 42 Less than 49 Less than 56 | 26 57 92 134 216 287 341 360 |
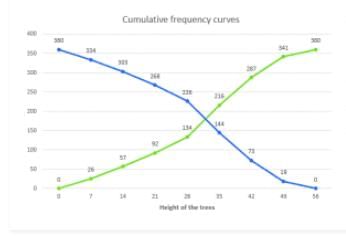
Draw ‘less than ‘ogive and ‘more than ‘ogive
Sol :
By less than method
| Height | No. of trees |
Less than 7 Less than 14 Less than 21 Less than 28 Less than 35 Less than 42 Less than 49 Less than 56 | 26 57 92 134 216 287 341 360 |
Plot the points (7,26) , (14,57) , (21,92) , (28,134) , (35,216) , (42,287) , (49,341) , (56,360) by taking upper class limit over the x-axis and cumulative frequency over the y-axis.
By more than method:
| Height | Frequency | Height more than | C.F. |
0-7 7-14 14-21 21-28 28-35 35-42 24-49 49-56 | 26 31 35 42 82 71 54 19 | 0 5 10 15 20 25 30 35 | 360 334 303 268 226 144 73 19 |
Take lower class limit over the x-axis and CF over the y-axis and plot (0,360) , (7,334) , (14,303) , (21,268) (28,226) , (35,144) , (42,73) , (49,19).
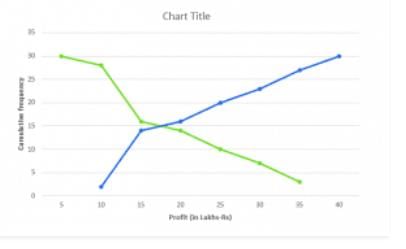
Q.10) The annual profits earned by 30 shops of a shopping complex in a locality give rise to the following distribution:
| Profit (In lakhs In Rs) | Number of shops (frequency) |
| More than or equal to 5 | 30 |
| More than or equal to 10 | 28 |
| More than or equal to 15 | 16 |
| More than or equal to 20 | 14 |
| More than or equal to 25 | 10 |
| More than or equal to 30 | 7 |
| More than or equal to 35 | 3 |
Draw both ogive for the above data and hence obtain the median.
Sol :
More than method
| Profit (In lakhs in Rs) | Number of shops (frequency) |
| More than or equal to 5 | 30 |
| More than or equal to 10 | 28 |
| More than or equal to 15 | 16 |
| More than or equal to 20 | 14 |
| More than or equal to 25 | 10 |
| More than or equal to 30 | 7 |
| More than or equal to 35 | 3 |
Now, we mark on x-axis lower class limits, y-axis cumulative frequency
Thus, we plot the points (5,30)(10,28)(15,16)(20,14)(25,10)(30,7) and (35,3)
Less than method
| Profit in lakhs | No of shops | Profits less than | C.F |
| 0-10 | 2 | 10 | 2 |
| 10-15 | 12 | 15 | 14 |
| 15-20 | 2 | 20 | 16 |
| 20-25 | 4 | 25 | 20 |
| 25-30 | 3 | 30 | 23 |
| 30-35 | 4 | 35 | 27 |
| 35-40 | 3 | 40 | 30 |
Now we mark the upper class limits along x-axis and cumulative frequency along y-axis.
Thus we plot the points (10,2)(15,14)(20,16)(25,20)(30,23)(35,27)(40,30)
We find that the two types of curves intersect of P from point L it is drawn on x-axis
The value of a profit corresponding to M is 17.5. Hence median is 17.5 lakh
|
5 videos|292 docs|59 tests
|
FAQs on Ex-7.6 Statistics, Class 10, Maths RD Sharma Solutions - Extra Documents, Videos & Tests for Class 10
| 1. What are the different types of statistical data? |  |
| 2. What is the importance of statistics in everyday life? |  |
| 3. What is the difference between mean, median, and mode? |  |
| 4. How can I calculate the standard deviation of a data set? |  |
| 5. What is the difference between a sample and a population in statistics? |  |
|
5 videos|292 docs|59 tests
|

|
Explore Courses for Class 10 exam
|

|


