Examples (with Solutions): Pie Chart

Example 1: The following pie chart shows the amount of subscription generated for Indian Bonds from different categories of Investors.

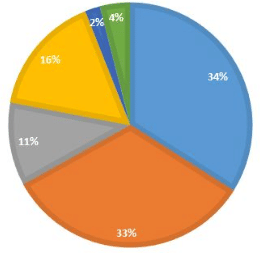
Question 1: If the investment by NRI's are INR 4,000 crore, then investment by both corporate houses and FII's together is:
(a) 24000 crores
(b) 24363 crores
(c) 25423.4 crores
(d) 25643.3 crores
Ans: (b)
Sol: If NRI investment = 4,000 crores represents 11% of total, total investment = 4,000 × 100/11 = 36,363.636... crores.
Combined share of corporate houses and FII's = 67% of total = 0.67 × 36,363.636... = 24,363.636... crores ≈ 24,363 crores (option b).
Question 2: What percentage of total investment is coming from either FII's or NRI's?
(a) 33%
(b) 44%
(c) 11%
(d) 22%
Ans: (b)
Sol: FII's contribute 33% and NRI's contribute 11%. Sum = 33% + 11% = 44% (option b).
Question 3: If the total investment other than by FII and corporate houses is INR 335,000 crore, then the investment by NRI's and offshore funds will be (approximately):
(a) 274,100
(b) 285,600
(c) 293,000
(d) Cannot be determined
Ans: (a)
Sol: The portion other than FII and corporate houses is 33% and equals 335,000 crores, so total investment = 335,000 × 100/33 = 1,015,151.515... crores.
NRI's and offshore funds together = 27% of total = 0.27 × 1,015,151.515... ≈ 274,090.9 crores ≈ 274,100 (option a).
Question 4: What is the approximate ratio of investment flows into India Bonds from NRI's to corporate houses?
(a) 1:4
(b) 1:3
(c) 3:1
(d) Cannot be determined
Ans: (b)
Sol: NRI's = 11% and corporate houses = 34%. Ratio = 11 : 34. Dividing both terms by 11 gives ≈ 1 : 3.09, which is approximately 1 : 3 (option b).
Question 5: In the corporate sector, approximately how many degrees should be there in the central angle?
(a) 120
(b) 121
(c) 122
(d) 123
Ans: (c)
Sol: Central angle = percentage × 360°.
Corporate houses = 34% → 0.34 × 360° = 122.4° ≈ 122° (option c).
Question 6: If the total investment flows from FII were to be doubled in the next year and the investment flows from all other sources had remained constant at their existing levels for this year, then what would be the proportion of FII investment in the total investment flows into Indian Bonds in the next year (approximately)?
(a) 40%
(b) 50%
(c) 60%
(d) 70%
Ans: (b)
Sol: Current FII share = 33. If doubled → 66. Other sources remain = 100 - 33 = 67. New total = 66 + 67 = 133.
Proportion of FII = 66/133 ≈ 0.4962 ≈ 49.6% ≈ 50% (option b).
Question 7: If the flow from the FII's after the doubling (of the previous question) were to the tune of US$ 500 million, what would be the total investment into Indian Bond in US dollars?
(a) 1000
(b) 1500
(c) 800
(d) Cannot be determined
Ans: (a)
Sol: After doubling, FII share ≈ 50% of total (from previous Q). If FII = 500 million = 50% of total, then total = 500 × 100/50 = 1,000 million dollars (option a).
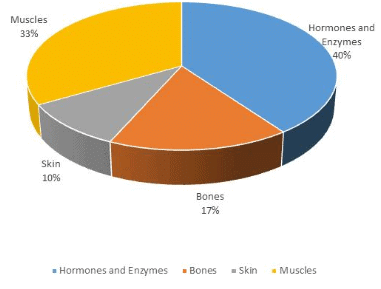
Example 2: Study the following diagram carefully and answer the questions:
Percentage Composition of Human Body
Question 1: What percent of the total weight of the human body is equivalent to the weight of the proteins in the skin in human body?
(a) 0.016
(b) 1.6
(c) 0.16
(d) Cannot be determined
Ans: (b)
Sol: Protein constitutes 16% of body weight; skin constitutes 10% of body weight. Protein in skin = 10% of 16% = 0.10 × 16% = 1.6% (option b).
Question 2: What will be the quantity of water in the body of a person weighing 50 kg?
(a) 20 kg
(b) 35 kg
(c) 41 kg
(d) 5 kg
Ans: (b)
Sol: Water is 70% of body weight. For 50 kg person: 0.70 × 50 kg = 35 kg (option b).
Question 3: What is the ratio of the distribution of proteins in the muscles to that of the distribution of proteins in the bones?
(a) 1:18
(b) 1:2
(c) 2:1
(d) 18:1
Ans: (c)
Sol: Proteins form 16% of body weight. Distribution: muscles = 33% of body, bones = 17% of body.
Protein in muscles = 0.16 × 33 = 5.28 (relative units).
Protein in bones = 0.16 × 17 = 2.72 (relative units).
Ratio ≈ 5.28 : 2.72 ≈ 1.94 : 1 ≈ 2 : 1 (option c).
Question 4: To show the distribution of proteins and the other dry elements in the human body, the arc of the circle should subtend at the centre an angle of;
(a) 54o
(b) 126o
(c) 108o
(d) 252o
Ans: (c)
Sol: Proteins = 16%, other dry elements = 14%. Combined = 16% + 14% = 30% of body.
Angle = 0.30 × 360° = 108° (option c).
Question 5: In the human body, what part is made of neither bones nor skin?
(a) 1/40
(b) 3/80
(c) 2/5
(d) None of these
Ans: (d)
Sol: Bones = 17% and skin = 10%. Portion that is neither = 100% - (17% + 10%) = 100% - 27% = 73% = 73/100, which does not match any given fraction choices, so option d (None of these).
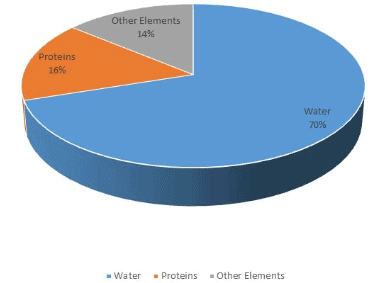
XAT 2012: The following pie chart shows the percentage distribution of runs scored by a batsman in a test innings.
Question 1: If the batsman has scored a total of 306 runs, how many 4's and 6's did he hit?
(a) 31 and 3 resp.
(b) 32 and 2 resp.
(c) 32 and 3 resp.
(d) 33 and 1 resp.
(e) 33 and 2 resp.
Ans: (e)
Sol: Total runs = 306. Runs from 4's = 43% of 306 = 0.43 × 306 = 131.58 ≈ 132 runs → number of 4's = 132/4 = 33.
Runs from 6's = 4% of 306 = 0.04 × 306 = 12.24 ≈ 12 runs → number of 6's = 12/6 = 2. Hence 33 and 2 (option e).
Question 2: If 5 dot balls had been hit for 4s, and if two of the shots for which the batsman scored 3 runs each had fetched him one run instead, what would have been the central angle of the sector corresponding to the percentage of runs scored in 4s?
(a) 160
(b) 163
(c) 165
(d) 167
(e) 170
Ans: (e)
Sol: Original runs from 4's = 43% of 306 ≈ 132 runs. If 5 more fours are added → 132 + (5 × 4) = 152 runs from fours.
Two 3's become 1's → net change in total runs = -(2 × 2) = -4 runs from these shots, but since we added 5 fours (+20 runs), overall total becomes 306 +16 = 322 runs.
Proportion of runs from 4's = 152/322. Central angle = (152/322) × 360° = 170° (option e).
SNAP 2005: Study the sector-wise sales of a group of companies for the financial year 2004-05 and answer the following question:
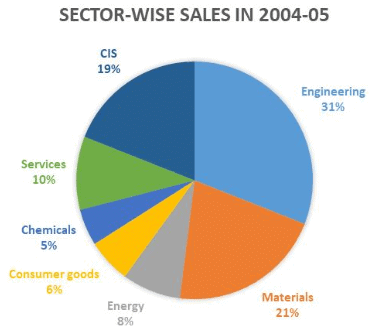
| Sectors | (Rs. Millions) | % Share |
| Materials | 1,64,430 | 21 |
| Engineering | 2,44,830 | 31.2 |
| Energy | 62,990 | 8 |
| Consumer goods | 47,880 | 6.1 |
| Chemicals | 35,510 | 4.5 |
| Communication and Information system | 1,48,160 | 18.9 |
| Services | 78,950 | 10.1 |
| Total | 7,82,750 | |
| *Sales turnover at US$ 17.4 billion (Rs. 78,224 crores) representing year-on-year growth of 30.3 % in dollar terms and 27.4 % in rupee terms. | ||
| *sales figures shown are net of excise duty | ||
Question 1: This group of companies operates in multiple sectors. The holding company has decided to closely monitor a minimum number of sectors (not exceeding 5) contribution together a major part (at least 80%) of sales of the group. Identify the correct set of sectors.
(a) Engineering, Services, CIS & Consumer Goods
(b) Engineering, Services, CIS, Energy & Consumer Goods
(c) Engineering, Materials, Services & CIS
(d) Engineering, Materials, CIS & Energy
Ans: (c)
Sol: Add the largest contributors until at least 80% is reached. Engineering 31.2% + Materials 21% + CIS 18.9% + Services 10.1% = 81.2% > 80%, so the set in option (c) meets the requirement.
Question 2: The average profit against the sales across the sectors is 10% while the profit margin of Engineering is 12% and CIS, 20%. What is the average profit across the remaining sectors?
(a) 5.87%
(b) 6.12%
(c) 4.94%
(d) 4%
Ans: (c)
Sol: Total sales = 782,750. Overall profit at 10% = 0.10 × 782,750 = 78,275.
Profit of Engineering = 12% of 244,830 = 0.12 × 244,830 = 29,379.6.
Profit of CIS = 20% of 148,160 = 0.20 × 148,160 = 29,632.0.
Profit of remaining sectors = 78,275 - (29,379.6 + 29,632.0) = 19,263.4.
Sales of remaining sectors = 782,750 - (244,830 + 148,160) = 389,760.
Average profit percentage for remaining sectors = (19,263.4 / 389,760) × 100 ≈ 4.94% (option c).
FAQs on Examples (with Solutions): Pie Chart
| 1. What is a pie chart? |  |
| 2. What is the purpose of using a pie chart? | |
| 3. How do you create a pie chart? | |
| 4. What are the advantages of using a pie chart? | |
| 5. Are there any limitations to using a pie chart? | |


