ICAI Notes- Measures of Central Tendency and Dispersion- 2 | Elementary Mathematics for CDS PDF Download

DEFINITION OF DISPERSION
The second important characteristic of a distribution is given by dispersion. Two distributions may be identical in respect of its first important characteristic i.e. central tendency and yet they may differ on account of scatterness. The following figure shows a number of distributions having identical measure of central tendency and yet varying measure of scatterness. Obviously, distribution is having the maximum amount of dispersion.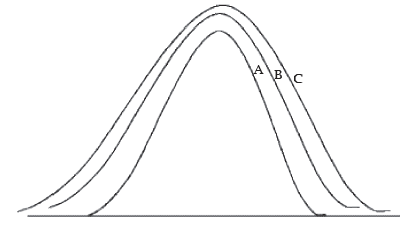
Showing distributions with identical measure of central tendency and varying amount of dispersion.
Dispersion for a given set of observations may be defined as the amount of deviation of the
observations, usually, from an appropriate measure of central tendency. Measures of dispersion may be broadly classified into
1. Absolute measures of dispersion.
2. Relative measures of dispersion.
Absolute measures of dispersion are classified into
(i) Range
(ii) Mean Deviation
(iii) Standard Deviation
(iv) Quartile Deviation
Likewise, we have the following relative measures of dispersion :
(i) Coefficient of Range.
(ii) Coefficient of Mean Deviation
(iii) Coefficient of Variation
(iv) Coefficient of Quartile Deviation.
We may note the following points of distinction between the absolute and relative measures of dispersion :
I Absolute measures are dependent on the unit of the variable under consideration whereas the relative measures of dispersion are unit free.
II For comparing two or more distributions, relative measures and not absolute measures
of dispersion are considered.
III Compared to absolute measures of dispersion, relative measures of dispersion are difficult to compute and comprehend.
Characteristics for an ideal measure of dispersion
As discussed in section 15.2.1 an ideal measure of dispersion should be properly defined, easy to comprehend, simple to compute, based on all the observations, unaffected by sampling fluctuations and amenable to some desirable mathematical treatment.
RANGE
For a given set of observations, range may be defined as the difference between the largest and smallest of observations. Thus if L and S denote the largest and smallest observations respectively then we have
Range = L – S
The corresponding relative measure of dispersion, known as coefficient of range, is given
by
Coefficient of range
For a grouped frequency distribution, range is defined as the difference between the two extreme class boundaries. The corresponding relative measure of dispersion is given by the ratio of the difference between the two extreme class boundaries to the total of these class boundaries, expressed as a percentage.
We may note the following important result in connection with range:
Result:
Range remains unaffected due to a change of origin but affected in the same ratio due toa change in scale i.e., if for any two constants a and b, two variables x and y are related by y =a + bx,
Then the range of y is given by
Example : Following are the wages of 8 workers expressed in Rupees. 82, 96, 52, 75, 70, 65, 50, 70. Find the range and also its coefficient.
Solution: The largest and the smallest wages are L = ₹96 and S= ₹50
Thus range = ₹ 96 – ₹50 = ₹ 46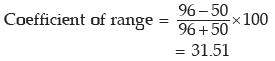
Example : What is the range and its coefficient for the following distribution of weights?
Solution: The lowest class boundary is 49.50 kgs. and the highest class boundary is 74.50 kgs. Thus we have
Range = 74.50 kgs. – 49.50 kgs.
= 25 kgs.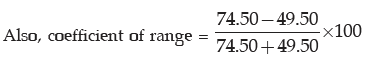

Example : If the relationship between x and y is given by 2x+3y=10 and the range
of x is ₹15, what would be the range of y?
Solution:
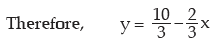
Applying, the range of y is given by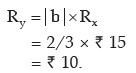
MEAN DEVIATION
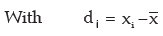
Since range is based on only two observations, it is not regarded as an ideal measure of dispersion.A better measure of dispersion is provided by mean deviation which, unlike range, is based on all the observations. For a given set of observation, mean deviation is defined as the arithmetic mean of the absolute deviations of the observations from an appropriate measure of central tendency. Hence if a variable x assumes n values x1, x2, x3…xn, then the mean deviation of x about an average A is given by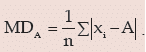
For a grouped frequency distribution, mean deviation about A is given by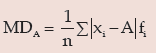
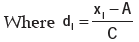
Where xi and fi denote the mid value and frequency of the i-th class interval and
In most cases we take A as mean or median and accordingly, we get mean deviation about mean or mean deviation about median.
A relative measure of dispersion applying mean deviation is given by
Mean deviation takes its minimum value when the deviations are taken from the median.
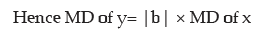
Also mean deviation remains unchanged due to a change of origin but changes in the same
ratio due to a change in scale i.e. if y = a + bx, a and b being constants,
Example : What is the mean deviation about mean for the following numbers?
5, 8, 10, 10, 12, 9.
Solution:
The mean is given by"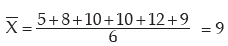
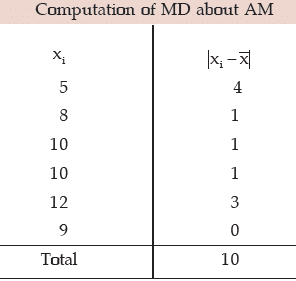
Thus mean deviation about mean is given by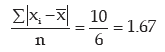
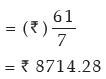
Example : Find mean deviations about median and also the corresponding coefficient
for the following profits (‘000 ₹) of a firm during a week.
82, 56, 75, 70, 52, 80, 68.
Solution:
The profits in thousand rupees is denoted by x. Arranging the values of x in an ascending order, we get
52, 56, 68, 70, 75, 80, 82.
Therefore, Me = 70. Thus, Median profit = ₹ 70,000.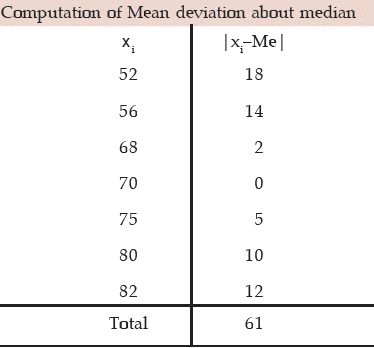


Example : Compute the mean deviation about the arithmetic mean for the following
data: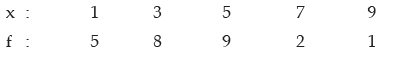
lso find the coefficient of the mean deviation about the AM.
Solution: We are to apply formula (15.1.2) as these data refer to a grouped frequency
distribution the AM is given by
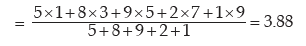
Computation of MD about the AM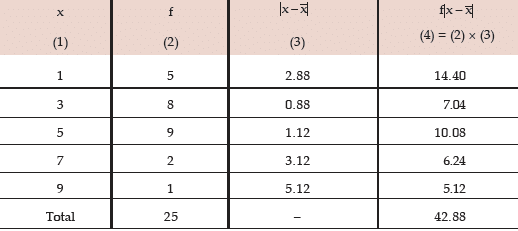
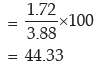
Thus, MD about AM is given by

=1.72
Example : Compute the coefficient of mean deviation about median for the following
distribution:
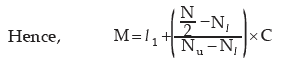
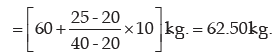
Solution: We need to compute the median weight in the first stage
Computation of median weight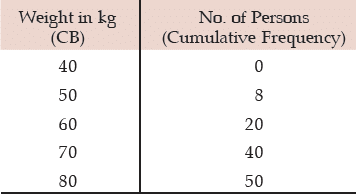
Computation of mean deviation of weight about median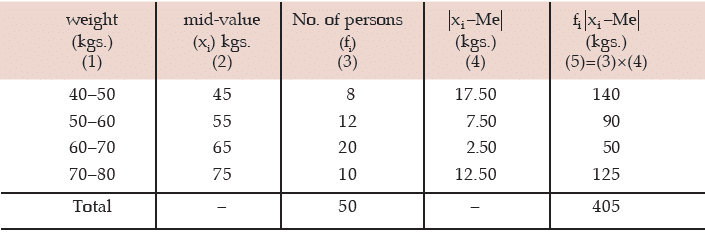


Example : If x and y are related as 4x+3y+11 = 0 and mean deviation of x is 5.40, what is
the mean deviation of y?
Solution: Since 4x + 3y + 11 = 0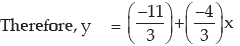

STANDARD DEVIATION
Although mean deviation is an improvement over range so far as a measure of dispersion is concerned, mean deviation is difficult to compute and further more, it cannot be treated
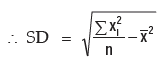
mathematically. The best measure of dispersion is, usually, standard deviation which does not possess the demerits of range and mean deviation. Standard deviation for a given set of observations is defined as the root mean square deviation when the deviations are taken from the AM of the observations. If a variable x assumes n values x1 ,x2, x3 ………..xn then its standard deviation(s) is given by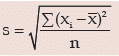
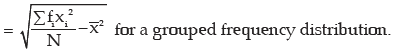
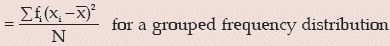
For a grouped frequency distribution, the standard deviation is given by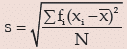
can be simplified to the following forms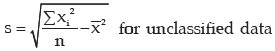
Sometimes the square of standard deviation, known as variance, is regarded as a measure of dispersion. We have, then,
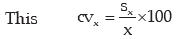
A relative measure of dispersion using standard deviation is given by coefficient of variation (cv) which is defined as the ratio of standard deviation to the corresponding arithmetic mean, expressed as a percentage.
ILLUSTRATIONS:
Example : Find the standard deviation and the coefficient of variation for the following
numbers: 5, 8, 9, 2, 6
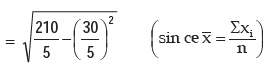
Solution: We present the computation in the following table.
Computation of standard deviation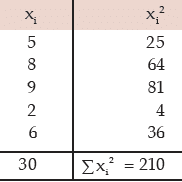
Applying (15.2.7), we get the standard deviation as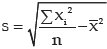

The coefficient of variation is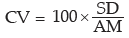
Example : Show that for any two numbers a and b, standard deviation is given
Solution: For two numbers a and b, AM is given by 
The variance is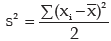
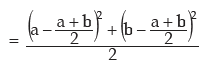
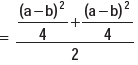

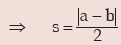
(The absolute sign is taken, as SD cannot be negative).
Example : Prove that for the first n natural numbers, SD is 
Solution: for the first n natural numbers AM is given by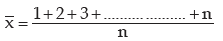


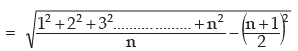
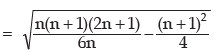
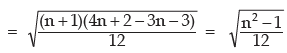
Thus, SD of first n natural numbers is 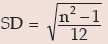
We consider the following formula for computing standard deviation from grouped frequency distribution with a view to saving time and computational labour: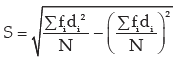
Example : Find the SD of the following distribution:
Solution:
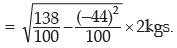
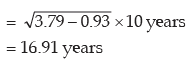
Computation of SD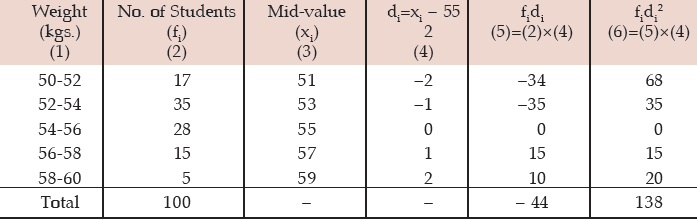
Applying (11.33), we get the SD of weight as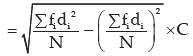

Properties of standard deviation
I. If all the observations assumed by a variable are constant i.e. equal, then the SD is zero.
This means that if all the values taken by a variable x is k, say, then s = 0. This result
applies to range as well as mean deviation.
II. SD remains unaffected due to a change of origin but is affected in the same ratio due to
a change of scale i.e., if there are two variables x and y related as y = a+bx for any two
constants a and b, then SD of y is given by
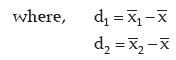
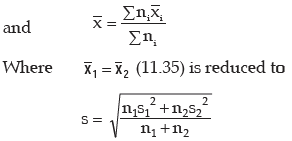
III. If there are two groups containing n1 and n2 observations, x1 and x2 as respective AM’s,
s1 and s2 as respective SD’s , then the combined SD is given by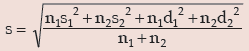

This result can be extended to more than 2 groups. For x(72) groups, we have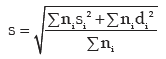
Example : If AM and coefficient of variation of x are 10 and 40 respectively, what is the variance of (15–2x)?
Solution: let y = 15 – 2x
Then applying (11.34), we get,
sy = 2 × sx ………………………………… (1)
As given cvx = coefficient of variation of x = 40 and 
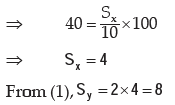
Therefore, variance of (15 2x) Sy2 64
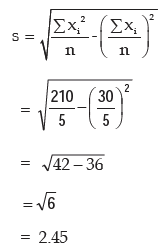
Example 15.2.14: Compute the SD of 9, 5, 8, 6, 2.
Without any more computation, obtain the SD of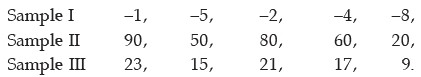
Computation of SD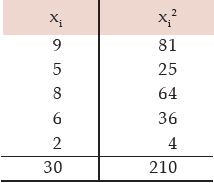
If we denote the original observations by x and the observations of sample I by y, then we have
y = –10 + x
y = (10) + (1) x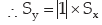
= 1 2.45
2.45
= 2.45
In case of sample II, x and y are related as
Y = 10x
= 0 + (15)x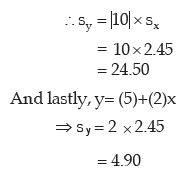
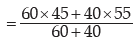
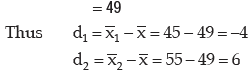
Example : For a group of 60 boy students, the mean and SD of stats. marks are 45 and2 respectively. The same figures for a group of 40 girl students are 55 and 3 respectively. Whatis the mean and SD of marks if the two groups are pooled together?
Solution: As given n1 = 60,
Thus the combined mean is given by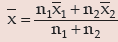
Applying, we get the combined SD as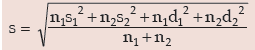
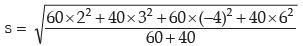

Example : The mean and standard deviation of the salaries of the two factories are provided below :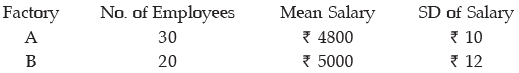
i) Find the combined mean salary and standard deviation of salary.
ii) Examine which factory has more consistent structure so far as satisfying its employees are concerned.
Solution: Here we are givenHere we are given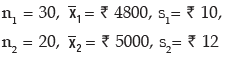
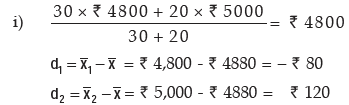
hence, the combined SD in rupees is given by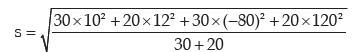

thus the combined mean salary and the combined standard deviation of salary are ` 4880 and ₹98.58 respectively.
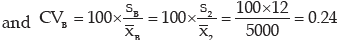
ii) In order to find the more consistent structure, we compare the coefficients of variation of the two factories. Letting CVA 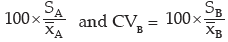
We would say factory A is more consistent if CVA < CVB . Otherwise factory B would be more consistent.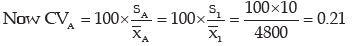
Thus we conclude that factory A has more consistent structure.
Example : A student computes the AM and SD for a set of 100 observations as 50 and 5respectively. Later on, she discovers that she has made a mistake in taking one observation as 60instead of 50. What would be the correct mean and SD if
i) The wrong observation is left out?
ii) The wrong observation is replaced by the correct observation?
Solution : As given, nx = 1000, S = 5
S = 5
Wrong observation = 60(x), correct observation = 50(V)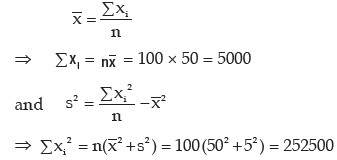
i) Sum of the 99 observations = 5000 – 60 = 4940
AM after leaving the wrong observation = 4940/99 = 49.90
Sum of squares of the observation after leaving the wrong observation
= 252500 – 602 = 248900
Variance of the 99 observations = 248900/99 – (49.90)2
= 2514.14 – 2490.01
= 24.13
SD of 99 observations = 4.91
ii) Sum of the 100 observations after replacing the wrong observation by the correct observation
= 5000 – 60 + 50 = 4990
Corrected sum of squares = 252500 + 502 – 602 = 251400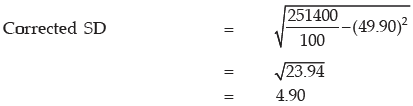
QUARTILE DEVIATION
Another measure of dispersion is provided by quartile deviation or semi-inter–quartile range which is given by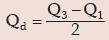
A relative measure of dispersion using quartiles is given by coefficient of quartile deviation
which is
Quartile deviation provides the best measure of dispersion for open-end classification. It is also less affected due to sampling fluctuations. Like other measures of dispersion, quartile deviation remains unaffected due to a change of origin but is affected in the same ratio due to change in scale.
Example : Following are the marks of the 10 students : 56, 48, 65, 35, 42, 75, 82, 60, 55,
50. Find quartile deviation and also its coefficient.
Solution: After arranging the marks in an ascending order of magnitude, we get 35, 42, 48, 50, 55, 56, 60, 65, 75, 82

= 8.25 th observation
= 65 + 0.25 × 10
= 67.50
Thus applying (11.37), we get the quartile deviation as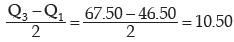
Also, using (11.38), the coefficient of quartile deviation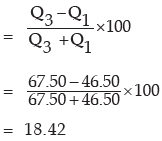
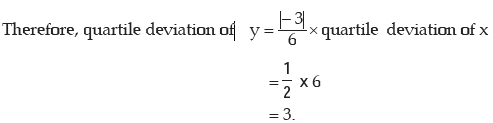
Example : If the quartile deviation of x is 6 and 3x + 6y = 20, what is the quartile deviation of y?
Solution: 3x + 6y = 20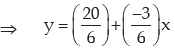
Example : Find an appropriate measures of dispersion from the following data:
Solution: Since this is an open-end classification, the appropriate measure of dispersion would be quartile deviation as quartile deviation does not taken into account the first twenty five percent and the last twenty five per cent of the observations.
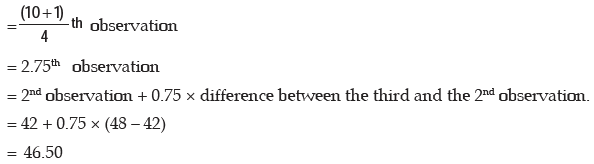
Computation of Quartile
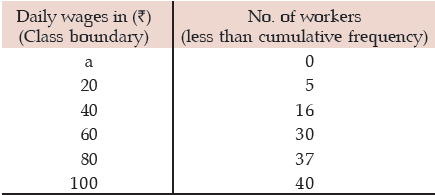
Here a denotes the first Class Boundary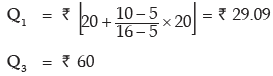
Thus quartile deviation of wages is given by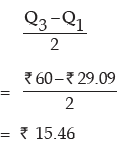
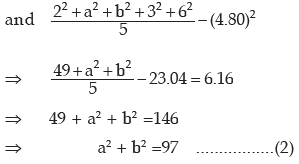
Example : The mean and variance of 5 observations are 4.80 and 6.16 respectively. If
three of the observations are 2, 3 and 6, what are the remaining observations?
Solution: Let the remaining two observations be a and b, then as given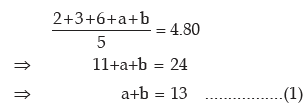
From (1), we get a = 13 – b ...........(3)
Eliminating a from (2) and (3), we get
(13 – b)2 + b2 = 97
169 – 26b + 2b2 = 97
b2 – 13 b + 36 = 0
(b–4)(b–9) = 0
b = 4 or 9
From (3), a= 9 or 4
Thus the remaining observations are 4 and 9.
Example : After shift of origin and change of scale, a frequency distribution of a
continuous variable with equal class length takes the following form of the changed variable (d):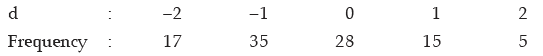
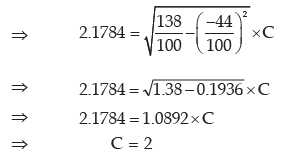
If the mean and standard deviation of the original frequency distribution are 54.12 and 2.1784 respectively, find the original frequency distribution.
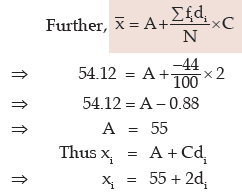
Solution: We need find out the origin A and scale C from the given conditions.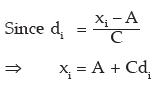
Once A and C are known, the mid- values xi’s would be known. Finally, we convert the midvalues to the corresponding class boundaries by using the formula: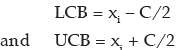
On the basis of the given data, we find that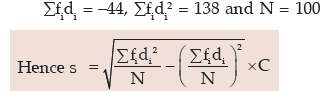
Computation of the Original Frequency Distribution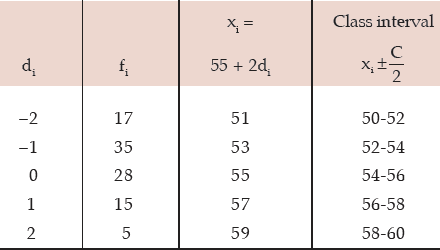
Example : Compute coefficient of variation from the following data: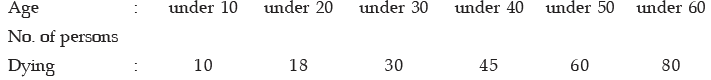
Solution: What is given in this problem is less than cumulative frequency distribution. Weneed first convert it to a frequency distribution and then compute the coefficient of variation.
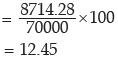
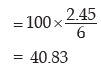
Computation of coefficient of variation Age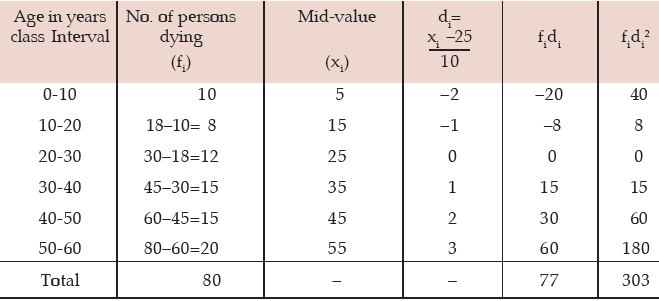
The AM is given by: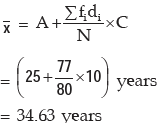
The standard deviation is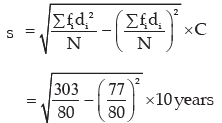
Thus the coefficient of variation is given by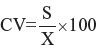

Example : You are given the distribution of wages in two factors A and B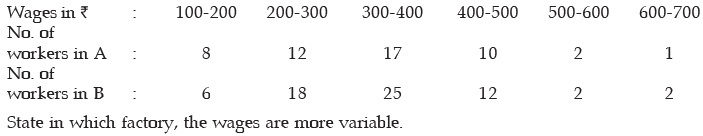
State in which factory, the wages are more variable.
Solution:
As explained in example 11.36, we need compare the coefficient of variation of A(i.e. vA) and of B (i.e vB).
If vA> vB, then the wages of factory A would be more variable. Otherwise, the wages of factory B would be more variable where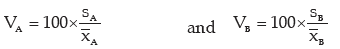
Computation of coefficient of variation of wages of Two Factories A and B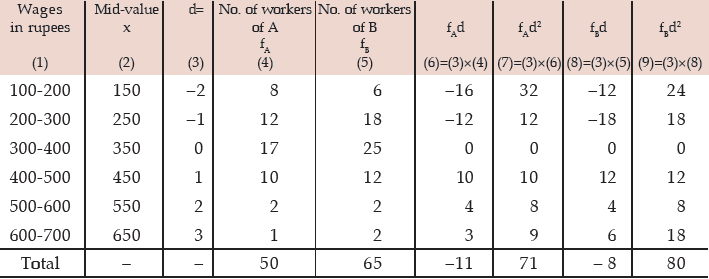
For Factory A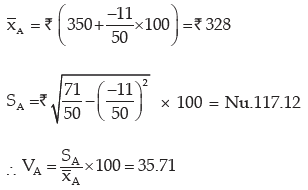
For Factory B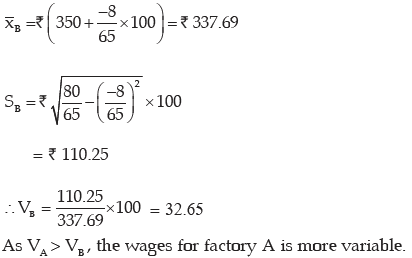
|
174 videos|104 docs|134 tests
|
FAQs on ICAI Notes- Measures of Central Tendency and Dispersion- 2 - Elementary Mathematics for CDS
| 1. What are measures of central tendency and dispersion? |  |
| 2. How is the mean calculated? | |
| 3. What is the median and how is it determined? | |
| 4. How is the range calculated? | |
| 5. What is the standard deviation and how is it calculated? | |


shortcuts and tricks
,MCQs
,ICAI Notes- Measures of Central Tendency and Dispersion- 2 | Elementary Mathematics for CDS
,Objective type Questions
,Important questions
,Semester Notes
,practice quizzes
,ppt
,Exam
,Viva Questions
,mock tests for examination
,Previous Year Questions with Solutions
,study material
,Free
,Summary
,past year papers
,ICAI Notes- Measures of Central Tendency and Dispersion- 2 | Elementary Mathematics for CDS
,video lectures
,Sample Paper
,ICAI Notes- Measures of Central Tendency and Dispersion- 2 | Elementary Mathematics for CDS
,Extra Questions
;


ICAI Notes- Measures of Central Tendency and Dispersion- 2 Free PDF Download
Importance of ICAI Notes- Measures of Central Tendency and Dispersion- 2
ICAI Notes- Measures of Central Tendency and Dispersion- 2
ICAI Notes- Measures of Central Tendency and Dispersion- 2 CDS Questions
Study ICAI Notes- Measures of Central Tendency and Dispersion- 2 on the App
|
© EduRev
|
Education Revolution
|


|


within 7 days!