Long Questions With Answers - Market Equilibrium

Q.1. How is equilibrium price of a commodity determined? Explain with the help of a demand and supply schedule.
Ans. Equilibrium price is the price at which the quantity demanded equals the quantity supplied. It occurs at the point where the market demand curve and market supply curve intersect.
Determination of Equilibrium Price:
Equilibrium price is determined by the interaction of market demand and market supply. Market demand is the horizontal sum of individual demand schedules, and market supply is the horizontal sum of individual supply schedules. We construct the market demand curve from the market demand schedule and the market supply curve from the market supply schedule. The price at which these two curves meet is the equilibrium price. This can be shown by the following table.
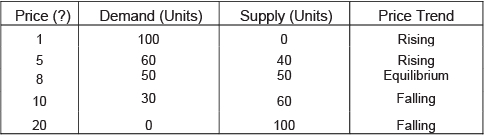
From the table, when the price of the good is very low (say Rs. 1 per unit), the quantity demanded is very high (100 units), but suppliers are unwilling to sell at that price so supply is zero. This creates excess demand, which makes buyers compete and pushes the price up. At price Rs. 5 per unit, quantity demanded is 60 units while quantity supplied is 40 units, so there is excess demand of 20 units and the price tends to rise. At price Rs. 8 per unit, quantity demanded equals quantity supplied (50 units each); therefore the market is in equilibrium at Rs. 8.
In contrast, at a very high price (say Rs. 20 per unit), supply is large (100 units) but no buyer wants to buy at that price, so demand is zero. This creates excess supply, which forces sellers to compete and reduces the price. For example, at Rs. 10 per unit supply is 60 units while demand is 30 units, creating excess supply of 30 units and pushing price down. Thus the price tends to move until it reaches the equilibrium price of Rs. 8 where demand and supply are equal.
Q.2. X and Y are complementary goods. Explain the sequence of effects of a fall in the price of X on the equilibrium price and quantity of Y.
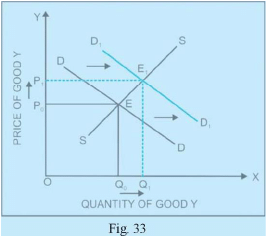
Ans. Complementary goods are goods that are used together to satisfy a particular want. If X and Y are complements, a fall in the price of X makes X cheaper and so consumers buy more of X. Because X and Y are used together, the rise in consumption of X raises the demand for Y. Consequently the market demand curve for Y shifts to the right.
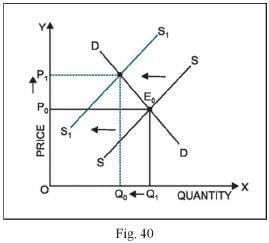
When the demand curve for Y shifts rightwards, at the original price there will be excess demand for Y. Buyers compete to obtain the good and this competition raises the price of Y. The higher price encourages sellers to supply more, and the market moves along the supply curve until a new equilibrium is reached at a higher price and a larger equilibrium quantity of Y. In the diagram, the initial equilibrium is E (with price OP0 and quantity OQ0). After the fall in price of X, demand for Y shifts right (from DD to D1) and the new equilibrium is at a higher price OP1 and higher quantity OQ1.
Q.3. Market of a commodity is in equilibrium. Demand for the commodity 'increases'. Explain the chain of effects of the change till the market again reaches equilibrium. Use diagram.
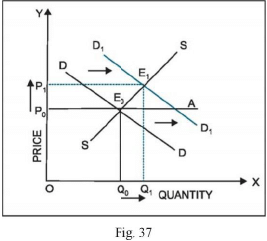
Ans. Common causes of an increase in demand include a rise in income (for a normal good), a rise in the price of substitute goods, a fall in the price of complementary goods, or favourable changes in tastes. When demand increases, the market demand curve shifts rightwards. At the original price this creates excess demand (shortage).
Excess demand causes buyers to compete, which bids up the price. As price rises, quantity demanded falls (movement along the demand curve) and quantity supplied rises (movement along the supply curve). These adjustments continue until quantity demanded equals quantity supplied at a new equilibrium with a higher price and higher quantity. In the diagram, demand shifts from DD to D1, creating shortage at the original price OP0. Price rises to OP1, and quantity increases to OQ1, which is the new equilibrium.
Q.4. Market for a commodity is in equilibrium. Demand for the commodity 'decreases'. Explain the chain of effects of this change till the market again reaches equilibrium. Also compare prices at old and new equilibrium.
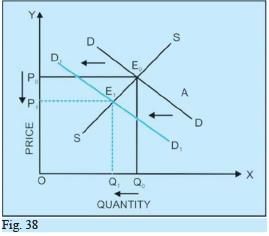
Ans. Causes of a decrease in demand include a fall in income (for a normal good), a fall in the price of substitute goods, a rise in the price of complements, or a change in tastes away from the good. When demand decreases, the demand curve shifts leftwards. At the original price this creates excess supply (surplus).
Excess supply leads sellers to compete to sell their stocks, which pulls the price down. As price falls, quantity demanded increases (movement along the demand curve) and quantity supplied decreases (movement along the supply curve). These adjustments continue until demand equals supply at the new equilibrium, which has a lower price and lower quantity than before. In the diagram, demand shifts from DD to D1, creating surplus at price OP0. Price falls to OP1, and quantity falls to OQ1, the new equilibrium. Thus the new equilibrium price is lower than the old equilibrium price, and the new equilibrium quantity is also lower.
Q.5. Market for a commodity is in equilibrium. Demand for the commodity 'increases'. Explain the chain of effects of this change till the market again reaches equilibrium. Also compare prices at old and new equilibrium.
Ans. A market is in equilibrium when demand equals supply. Typical reasons for an increase in demand are a rise in income, a rise in the price of substitutes, a fall in the price of complements, or a positive change in preferences. The following numerical example illustrates the chain of effects:
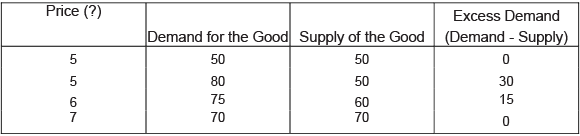
Initially the market is in equilibrium at price Rs. 5 where quantity demanded equals quantity supplied at 50 units. Suppose demand at price Rs. 5 increases from 50 units to 80 units (for example, because consumers' incomes have risen), while supply at that price remains 50 units. This creates an excess demand of 30 units (80 - 50). Buyers compete for the limited supply and bid the price up from Rs. 5 to Rs. 6. At Rs. 6, the higher price reduces quantity demanded from 80 to 75 units and increases quantity supplied from 50 to 60 units. The shortage narrows but still exists, so price rises further. These adjustments continue until price reaches Rs. 7, where quantity demanded and supplied are again equal at 70 units. Therefore the new equilibrium price and quantity are Rs. 7 and 70 units respectively. Both equilibrium price and equilibrium quantity have increased compared with the original equilibrium.
Q.6. Market for a good is in equilibrium. The supply of good 'decreases'. Explain the chain of effects of this change.
Ans. The main causes of a decrease in supply include an increase in input prices, a fall in productivity or technology, taxes or other unfavourable government policies, or adverse natural events. A decrease in supply means less quantity is offered at each price, so the supply curve shifts leftwards from SS to SS1.
At the original price this leftward shift creates excess demand (shortage). Buyers compete, which pushes the price up. As price rises, quantity demanded falls (movement along the demand curve) and quantity supplied rises (movement along the new supply curve). These adjustments continue until the market reaches a new equilibrium at a higher price and a lower quantity than before. In the diagram, the supply shift from SS to SS1 creates shortage at price OP0; price rises to OP1 and quantity falls to OQ1, the new equilibrium.
FAQs on Long Questions With Answers - Market Equilibrium
| 1. What is market equilibrium? |  |
| 2. How is market equilibrium determined? | |
| 3. What happens if there is excess demand in the market? | |
| 4. What happens if there is excess supply in the market? | |
| 5. What factors can shift the supply and demand curves, affecting market equilibrium? | |


