NCERT Exemplar: Statistics | Mathematics (Maths) Class 10 PDF Download

Exercise 13.1
Q.1. In the formula x̄ = a + f idi/f i for finding the mean of grouped data di ’s are deviations from a of(a) lower limits of the class
(b) upper limits of the classes
(c) mid points of the classes
(d) frequencies of the class marks
Correct Answer is option (c)
In the formula given
x = a + fi difi
a is the assumed mean from the class mark xi
di = xi - a
xi is the data
di is the deviation of class mark (mid value) from the assumed mean ‘a’
Therefore, di’s are deviations from ‘a’ of mid points of the classes.
Q.2. While computing mean of grouped data, we assume that the frequencies are
(a) evenly distributed over all the classes
(b) centred at the classmarks of the classes
(c) centred at the upper limits of the classes
(d) centred at the lower limits of the classes
Correct Answer is option (b)
While computing mean of grouped data, we assume that the frequencies are centred at the classmarks of the classes
Therefore, the frequencies are centred at the classmarks of the classes.
Q.3. If xi ’s are the mid points of the class intervals of grouped data, fi ’s are the corresponding frequencies and x̄ is the mean, then (fixi - x̄) is equal to
(a) 0
(b) -
(c) 1
(d) 2
Correct Answer is option (a)
We know that
Mean (x) = Sum of all the observations/ Number of observations
Here
x = (f1x1 + f2x2 + …..+ fnxn) / f1 + f2 +……+ fn
x = Σfixi / Σfi, Σfi = n
x = Σfixi / n
By cross multiplication
n x = Σfixi --- (1)
So we get
Σ (fixi - x) = (f1x1 - x) + (f2x2 - x)+ …..+ (fnxn - x)
Σ (fixi - x) = (f1x1 + f2x2 + …..+ fnxn) - (x + x +….n times)
We can write it as
Σ (fixi - x) = Σfixi - nx
Σ(fixi - x) = nx - nx (From equation 1)
Σ(fixi - x) = 0
Therefore, (fixi−¯¯¯x) is equal to 0.
Q.4. In the formula x̄ = a + h fi ui/ fi, for finding the mean of grouped frequency distribution, ui =
(a) xi + a /h
(b) h(xi - a)
(c) xi - a /h
(d) a - xi /h
Correct Answer is option (c)
From the question
x = a + h (fiui/fi)
It is the step deviation formula
Where
xi = data values
a = assumed mean
h = class size
When the class size is similar, the calculation of mean can be simplified by using the coded mean of u1, u2, u3 …..
Where ui = (xi - a)/h
Therefore, for finding the mean of grouped frequency distribution, ui = (xi - a)/h.
Q.5. The abscissa of the point of intersection of the less than type and of the more than type cumulative frequency curves of a grouped data gives its
(a) mean
(b) median
(c) mode
(d) all the three above
Correct Answer is option (b)
Ogive is a free hand graph
The abscissa (x-coordinate) of the intersection of the less than type and of the more than type gives the median
In the graph, the point of intersection is (15, 40)
x coordinate 15 is the medianTherefore, cumulative frequency curves of a grouped data gives its median.
Q.6. For the following distribution :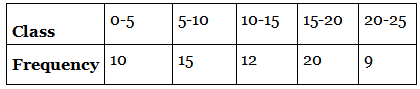 the sum of lower limits of the median class and modal class is
(a) 15
(b) 25
(c) 30
(d) 35
Correct Answer is option (b)
We know that
N/2 = 66/2 = 33 that lies in the interval 10-15
10 is the lower limit of the median class
20 is the highest frequency that lies between the interval 15-20
So the lower limit of modal class is 15
Required sum = 10 + 15 = 25
Therefore, the sum of lower limits of the median class and modal class is 25.
Q.7. Consider the following frequency distribution :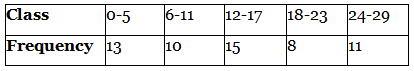 The upper limit of the median class is
(a) 17
(b) 17.5
(c) 18
(d) 18.5
Correct Answer is option (b)
As the classes are not continuous, we have to make the data continuous by subtracting 0.5 from lower limit and adding 0.5 to the upper limit of each classFrom the question,
N/2 = 57/2 = 28.5
We know that 28.5 lies between the interval 11.5-17.5
So the upper limit is 17.5
Therefore, the upper limit of the median class is 17.5.
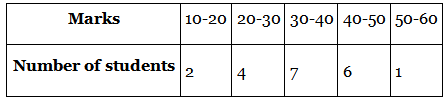
Q.8. For the following distribution :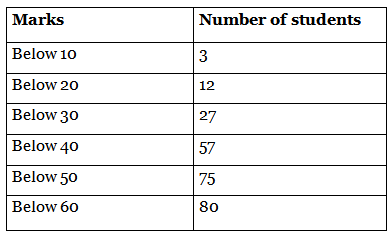 the modal class is
(a) 10-20
(b) 20-30
(c) 30-40
(d) 50-60
Correct Answer is option (c)
For the following frequency distribution:From the table, we know that the highest frequency is 30 that lies between the interval 30-40.
Therefore, the modal class is 30-40.
Q.9. Consider the data :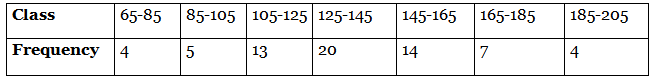 The difference of the upper limit of the median class and the lower limit of the modal class is
(a) 0
(b) 19
(c) 20
(d) 38
Correct Answer is option (c)
The cumulative frequency table isWe know that
N/2 = 67/2 = 33.5
So the median class=125-145
The upper limit is 145
Here is modal class is the class with maximum frequency
Modal class is 125-145
The lower limit is 125
Difference of upper and lower limit = 145 - 125 = 20
Therefore, the difference between the upper limit of the median class and the lower limit of the modal class is 20.
Q.10. The times, in seconds, taken by 150 atheletes to run a 110 m hurdle race are tabulated below :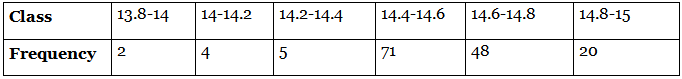 The number of atheletes who completed the race in less then 14.6 seconds is :(a) 11(b) 71(c) 82(d) 130
Correct Answer is option (c)
The number of athletes who completed the race in less then 14.6 seconds is the sum of all frequencies up to the class interval 14.4-14.6
= 2 + 4 + 5 + 71
= 82
Therefore, the number of athletes who completed the race in less than 14.6 seconds is 82.
Q.11. Consider the following distribution :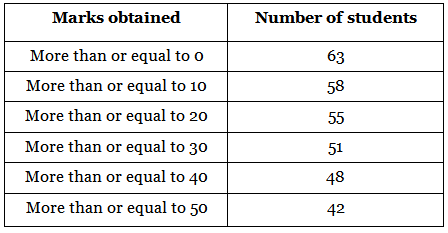 the frequency of the class 30-40 is(a) 3(b) 4
(c) 48
(d) 51
Correct Answer is option (a)
Here the frequency of the class 30-40 is 3.
Therefore, the frequency of the class 30-40 is 3.
Exercise 13.2
Q.1. The median of an ungrouped data and the median calculated when the same data is grouped are always the same. Do you think that this is a correct statement? Give reason.Not Correct.
To calculate the median of a grouped data the formula which is used is based on the assumption that the observations in the classes are equally spaced or uniformly distributed
So the statement is not always correct.
Therefore, the statement is not correct.
Q.2. In calculating the mean of grouped data, grouped in classes of equal width, we may use the formula x = a + fidi/fi
where a is the assumed mean. a must be one of the mid-points of the classes. Is the last statement correct? Justify your answer.
Not Correct
We know that
It is not required that assumed mean should be the mid points of the classes
a can be taken as any value which is easy for simplification
Therefore, the statement is not correct.
Q.3. Is it true to say that the mean, mode and median of grouped data will always be different? Justify your answer.
False
The value of mean, mode and median of grouped data can be the same also and depends on the type of data provided.
Therefore, the statement is false.
Q.4. Will the median class and modal class of grouped data always be different? Justify your answer.
False
The median class and modal class of grouped data is not always different and depends on the data provided.
Therefore, the statement is not correct.
Exercise 13.3
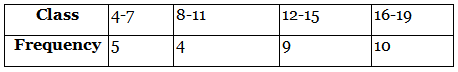
Q.1. Find the mean of the distribution : 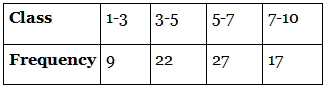
Given, the above data represents the class and frequency.
We have to find the mean of the distribution.By direct method,
Mean = ∑fx / ∑f
From the table,
Mean = 412.5/75
= 5.5
Therefore, the mean is 5.5
Q.2. Calculate the mean of the scores of 20 students in a mathematics test :
Given, the above data represents the marks scored by the number of students in a mathematics test.
We have to determine the mean of the scores of 20 students.By direct method,
Mean = ∑fx / ∑f
From the table,
Mean = 700/20
= 70/2
= 35
Therefore, the mean is 35.
Q.3. Calculate the mean of the following data :
Given, the above data gives the class and frequency.
We have to find the mean of the data.By direct method,
Mean = ∑fx / ∑f
From the table,
Mean = 362/28
= 12.928
Therefore, the mean is 12.928
Q. 4. The following table gives the number of pages written by Sarika for completing her own book for 30 days :
Find the mean number of pages written per day.
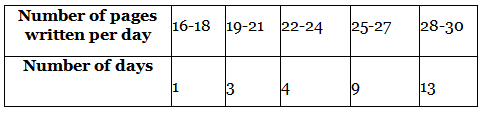
Given, the above data gives the number of pages written by Sarika for completing her own book for 30 days.
We have to find the mean number of pages written per day.By direct method,
Mean = ∑fx / ∑f
From the table,
Mean = 780/30
= 78/3
= 26
Therefore, the mean is 26.
Q.5. The daily income of a sample of 50 employees are tabulated as follows :
Find the mean daily income of employees.
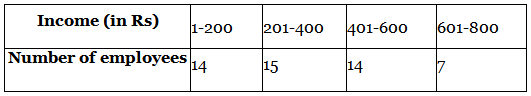
Given, the data represents the daily income of a sample of 50 employees.
We have to find the mean daily income of employees.By direct method,
Mean = ∑fx / ∑f
From the table,
Mean = 17825/50
= 356.5
Therefore, the mean is 356.5
Q.6. An aircraft has 120 passenger seats. The number of seats occupied during 100 flights is given in the following table : Determine the mean number of seats occupied over the flights.
Given, the data represents the seats occupied during 100 flights.
An aircraft has 120 passenger seats.
We have to find the mean number of seats occupied over the flights.By direct method,
Mean = ∑fx / ∑f
From the table,
Mean = 10992/100
= 109.92
Since the seats cannot be in decimal.
Therefore, the mean of seats is 109.92.
Q. 7. The weights (in kg) of 50 wrestlers are recorded in the following table :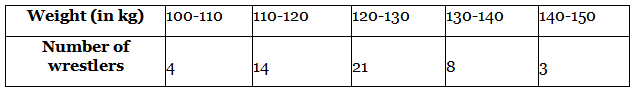
Find the mean weight of the wrestlers.
Given, the data represents the weights of 50 wrestlers.
We have to find the mean weight of the wrestlers.By direct method,
Mean = ∑fx / ∑f
From the table,
Mean = 6170/50
= 617/5
= 123.4
Therefore, the mean is 123.4 kg
Q.8. The mileage (km per litre) of 50 cars of the same model was tested by a manufacturer and details are tabulated as given below :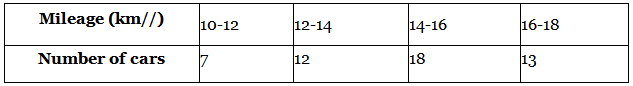 Find the mean mileage.The manufacturer claimed that the mileage of the model was 16 km/litre. Do you agree with this claim?
Given, the data represents the mileage of 50 cars of the same model tested by a manufacturer.
We have to find the mean mileage of the cars.By direct method,
Mean = ∑fx / ∑f
From the table,
Mean = 724/50
= 14.48
Therefore, the mean mileage is 14.48 km/litre.
Given, the manufacturer claimed that the mileage of the model was 16 km/litre.
Difference in mileage = 16 - 14.48
= 1.52 km/litre
Therefore, the mean mileage is 1.52 km/litre less than the manufacturers claim.
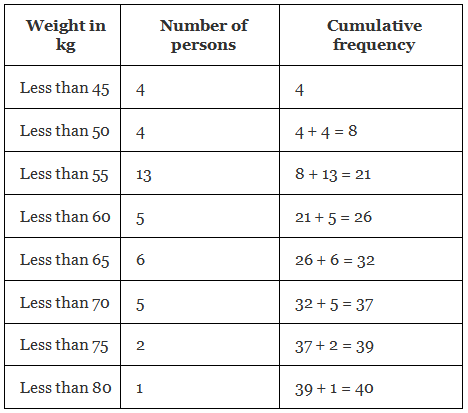
Q.9. The following is the distribution of weights (in kg) of 40 persons : 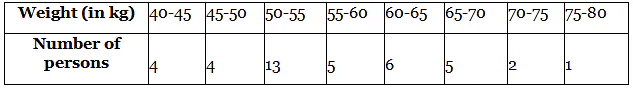 Construct a cumulative frequency distribution (of the less than type) table for the data above.
Given, the data represents the weight of 40 persons.
We have to construct a cumulative frequency distribution of the less than type table for the data.
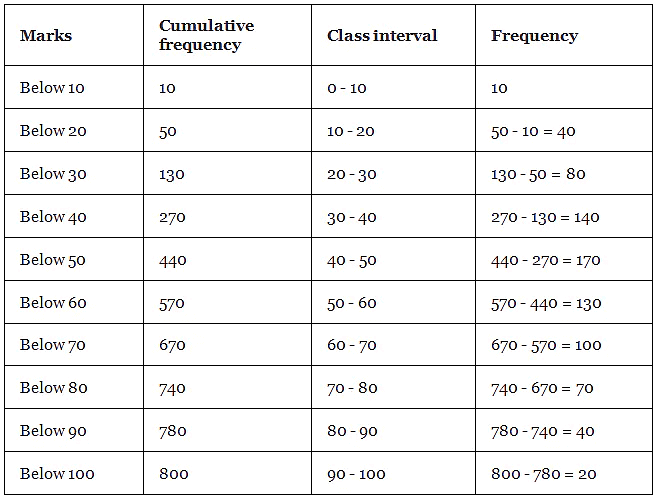
Q. 10. The following table shows the cumulative frequency distribution of marks of 800 students in an examination: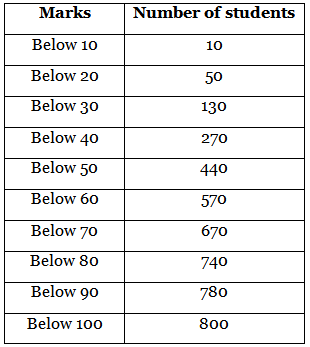 Construct a frequency distribution table for the data above.
Given, the data represents the cumulative frequency of marks of 800 students in an examination.
We have to construct a frequency distribution table for the data.
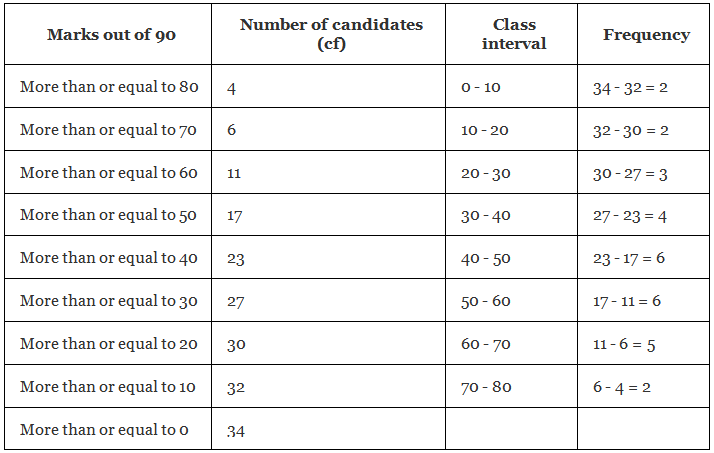
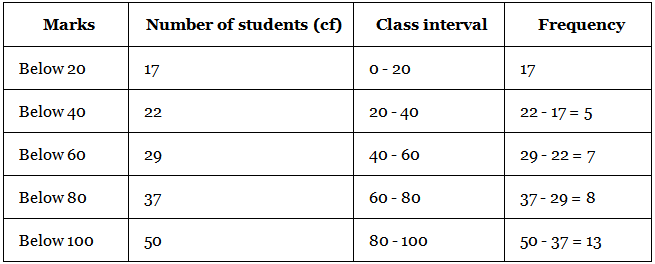
Q.11. Form the frequency distribution table from the following data :
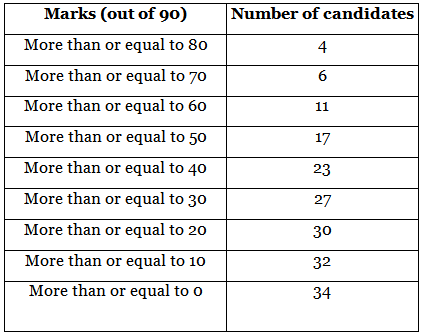
Given, the data represents the cumulative frequency of the marks of the candidates.
We have to form the frequency distribution table from the data.
Q.12. Find the unknown entries a, b, c, d, e, f in the following distribution of heights of students in a class :
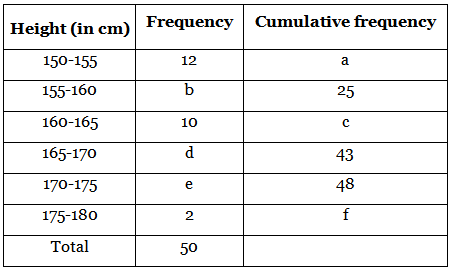
Given, the data represents the frequency and cumulative frequency of heights of students in a class.
We have to find the values of the unknown entries a, b, c, d, e, f.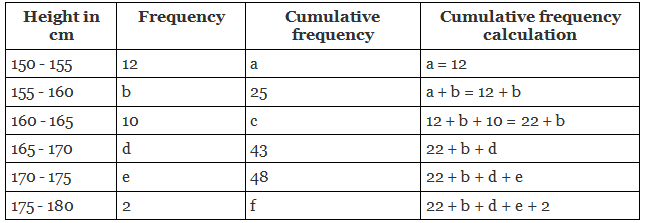 From the table,
12 + b = 25
b = 25 - 12
b = 13
22 + b = c
c = 22 + 13
c = 35
22 + b + d = 43
22 + 13 + d = 43
35 + d = 43
d = 43 - 35
d = 8
22 + b + d + e = 48
22 + 13 + 8 + e = 48
35 + 8 + e = 48
43 + e = 48
e = 48 - 43
e = 5
22 + b + d + e + 2 = f
22 + 13 + 8 + 5 + 2 = f
f = 50
Therefore, the values of unknown entries are a = 12, b = 13, c = 35, d = 8, e = 5, f = 50.
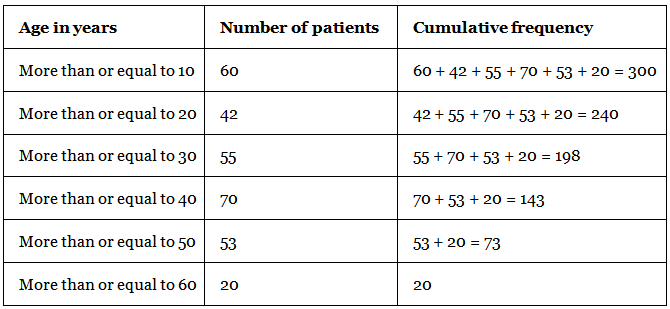
Q.13. The following are the ages of 300 patients getting medical treatment in a hospital on a particular day :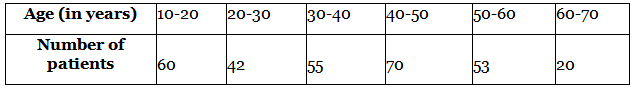 Form:(i) Less than type cumulative frequency distribution.
(ii) More than type cumulative frequency distribution.
(i) Given, the data represents the ages of 300 patients getting medical treatment in a hospital on a particular day.
We have to form the cumulative frequency distribution of less than type.(ii) Given, the data represents the ages of 300 patients getting medical treatment in a hospital on a particular day.
We have to form the cumulative frequency distribution of more than type.
Q.14. Given below is a cumulative frequency distribution showing the marks secured by 50 students of a class :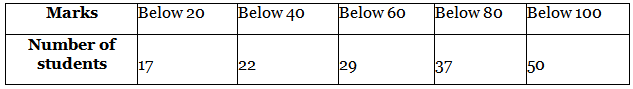 Form the frequency distribution table for the data.
Given, the data represents the cumulative frequency distribution of the marks secured by 50 students of a class.
We have to form the frequency distribution table for the data.
Q. 15. Weekly income of 600 families is tabulated below :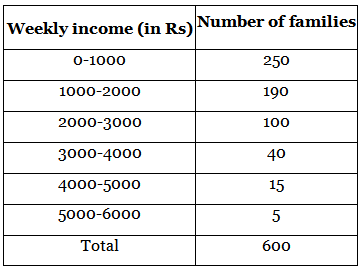 Compute the median income.
Given, the weekly income of 600 families.
We have to find the median income.Median = l + [(n/2 - cf)/f]h
Where, l is lower limit of the median class
n is the number of observations
h is the class size
cf is the cumulative frequency of the class preceding the median class
f is the frequency of the median class
From the table,
n/2 = 600/2 = 300
The observation lies in the class 1000 - 2000
Lower limit of the class, l = 1000
Class size, h = 1000
Cumulative frequency of the class preceding the median class, cf = 250
Frequency of the median class, f = 190
Median = 1000 + [(300 - 250)/190](1000)
= 1000 + [(50/190)(1000)]
= 1000 + [5(1000)/19]
= 1000 + 263.15
= 1263.15
Therefore, the median is 1263.15
Q.16. The maximum bowling speeds, in km per hour, of 33 players at a cricket coaching centre are given as follows :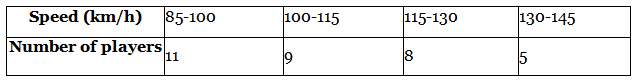 Calculate the median bowling speed.
Given, the data represents the maximum bowling speeds of 33 cricket players at a cricket coaching centre.
We have to find the median bowling speed.Median = l + [(n/2 - cf)/f]h
Where, l is lower limit of the median class
n is the number of observations
h is the class size
cf is the cumulative frequency of the class preceding the median class
f is the frequency of the median class
From the table,
n/2 = 33/2 = 16.5
The observation lies in the class 100 - 115
Lower limit of the class, l = 100
Class size, h = 15
Cumulative frequency of the class preceding the median class, cf = 11
Frequency of the median class, f = 9
Median = 100 + [(16.5 - 11)/9](15)
= 100 + [(5.5/9)(15)]
= 100 + 9.167
= 109.167
Therefore, the median is 109.167.
Q. 17. The monthly income of 100 families are given as below :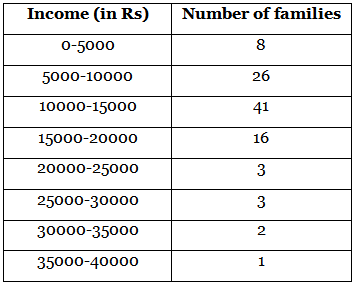 Calculate the modal income.
Given, the monthly income of 100 families.
We have to find the modal income.Mode = l + [(f₁ - f₀)/(2f₁ - f₀ - f₂)]h
Where, l is the lower limit of the modal class
f₁ is the frequency of the modal class
f₀ is the frequency preceding the modal class
f₂ is the frequency succeeding the modal class
h is the class size
From the table,
Maximum frequency = 41
This frequency lies in the class 10000 - 15000
l = 10000
h = 5000
f₁ = 41
f₀ = 26
f₂ = 16
Now, f₁ - f₀ = 41 - 26 = 15
2f₁ - f₀ - f₂ = 2(41) - 26 - 16
= 82 - 42
= 40
[(f₁ - f₀)/(2f₁ - f₀ - f₂)] = 15/40
= 3/8
Now, mode = 10000 + (3/8)(5000)
= 10000 + (15000/8)
= 10000 + 1875
= 11875
Therefore, the modal income is 11875.
Q. 18. The weight of coffee in 70 packets are shown in the following table :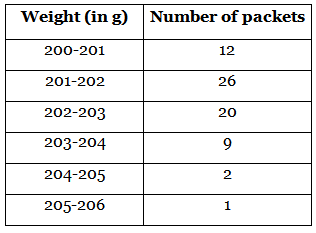 Determine the modal weight.
Given, the weight of coffee in 70 packets.
We have to find the modal weight.Mode = l + [(f₁ - f₀)/(2f₁ - f₀ - f₂)]h
Where, l is the lower limit of the modal class
f₁ is the frequency of the modal class
f₀ is the frequency preceding the modal class
f₂ is the frequency succeeding the modal class
h is the class size
From the table,
Maximum frequency = 26
This frequency lies in the class 201 - 202
l = 201
h = 1
f₁ = 26
f₀ = 12
f₂ = 20
Now, f₁ - f₀ = 26 - 12 = 14
2f₁ - f₀ - f₂ = 2(26) - 12 - 20
= 52 - 32
= 20
[(f₁ - f₀)/(2f₁ - f₀ - f₂)] = 14/20
= 7/10
= 0.7
Now, mode = 201 + 0.7(1)
= 201 + 0.7
= 201.7
Therefore, the mode is 201.7 g
|
127 videos|584 docs|79 tests
|
FAQs on NCERT Exemplar: Statistics - Mathematics (Maths) Class 10
| 1. What are the key concepts covered in NCERT Exemplar Statistics? |  |
| 2. How can I effectively solve problems from Exercise 13.1, 13.2, and 13.3? | |
| 3. What are some tips for preparing for the Statistics exam? | |
| 4. How does the NCERT Exemplar Statistics help in understanding real-world applications of statistics? | |
| 5. Where can I find additional resources for studying Statistics beyond the NCERT Exemplar? | |


Extra Questions
,Summary
,MCQs
,mock tests for examination
,Objective type Questions
,Previous Year Questions with Solutions
,Sample Paper
,study material
,NCERT Exemplar: Statistics | Mathematics (Maths) Class 10
,Exam
,NCERT Exemplar: Statistics | Mathematics (Maths) Class 10
,Semester Notes
,shortcuts and tricks
,video lectures
,Important questions
,Viva Questions
,practice quizzes
,NCERT Exemplar: Statistics | Mathematics (Maths) Class 10
,ppt
,past year papers
,Free
;


NCERT Exemplar: Statistics Free PDF Download
Importance of NCERT Exemplar: Statistics
NCERT Exemplar: Statistics Notes
NCERT Exemplar: Statistics Class 10 Questions
Study NCERT Exemplar: Statistics on the App
|
© EduRev
|
Education Revolution
|


|


