Chapter 3 - Pair Of Linear Equations In Two Variables, RD Sharma Solutions - (Part-11) | RD Sharma Solutions for Class 10 Mathematics PDF Download
Page No 3.30
Q.29. Draw the graphs of the following equations:
2x − 3y + 6 = 0
2x + 3y − 18 = 0
y − 2 = 0
Find the vertices of the triangle so obtained. Also, find the area of the triangle.
Ans. The given equations are
2x - 3y + 6 = 0 ....(i)
2x + 3y - 18 = 0 ....(ii)
y - 2 = 0 ....(iii)
The two points satisfying (i) can be listed in a table as,
The two points satisfying (ii) can be listed in a table as,
The two points satisfying (iii) can be listed in a table as,
Now, graph of equations (i), (ii) and (iii) can be drawn as,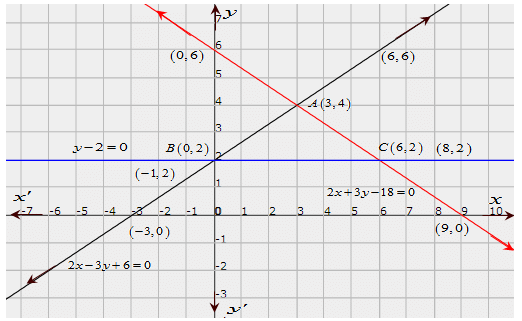
It is seen that the coordinates of the vertices of the obtained triangle are
A(3,4), B(0,2), C(6,2)
∴ Area of ΔABC =
Q.30. Solve the following system of equations graphically.
2x − 3y + 6 = 0
2x + 3y − 18 = 0
Also, find the area of the region bounded by these two lines and y-axis.
Ans. The given equations are:
2x − 3y + 6 = 0 ....(i)
2x + 3y − 18 = 0 ....(ii)
Putting x = 0 in equation (i) we get:
⇒ 2 x 0 - 3y - 6
⇒ y = 2
x = 0, y = 2
Putting y = 0 in equation (i) we get:
⇒ 2x - 3 x 0 = -6
⇒ x = -3
x = -3, y = 0
Use the following table to draw the graph
Draw the graph by plotting the two points A(0,2), B(-3,0) from table.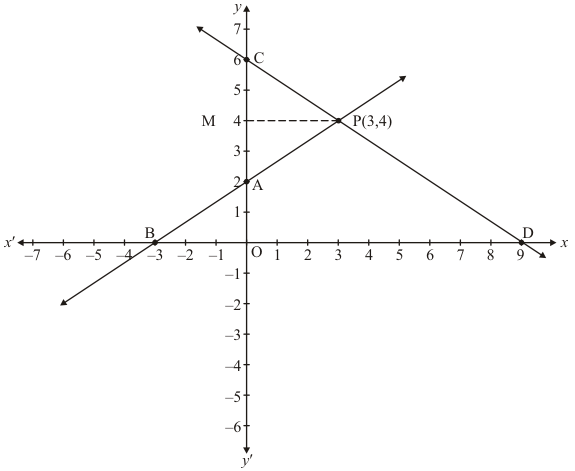
2x + 3y - 18 = 0 ....(ii)
Putting x = 0 in equation (ii) we get:
⇒ 2 x 0 + 3y = 18
⇒ y = 6
x = 0, y = 6
Putting y = 0 in equation (ii), we get:
⇒ 2x + 3 x 0 = 18
⇒ x = 9
x = 9,y = 0
Use the following table to draw the graph.
Draw the graph by plotting the two points C (0,6), D(9,0) from table.
The two lines intersect at P(3,4).
Hence x = 3, y = 4 is the solution of the given equations.
The area enclosed by the lines represented by the given equations and the y−axis
Now,
⇒ Required area = Area of PCA
⇒ Required area = 1/2(base x height)
⇒ Required area = 1/2(CA x PM)
⇒ Required area = 1/2 (4 x 3) sq. units
Hence the required area is 6 sq. units
Q.31. Solve the following system of linear equations graphically.
4x − 5y − 20 = 0
3x + 5y − 15 = 0
Determine the vertices of the triangle formed by the lines representing the above equation and the y-axis.
Ans. The given equations are:
4x - 5y - 20 = 0 ....(i)
3x + 5y − 15 = 0 ....(ii)
Putting x = 0 in equation (i),we get:
⇒ 4 x 0 - 5y = 20
⇒ y = - 4
x = 0, y - 4
Putting y = 0 in equation (i),we get:
⇒ 4x -5 x 0 = 20
⇒ x = 5
x = 5, y = 0
Use the following table to draw the graph.
Draw the graph by plotting the two points from table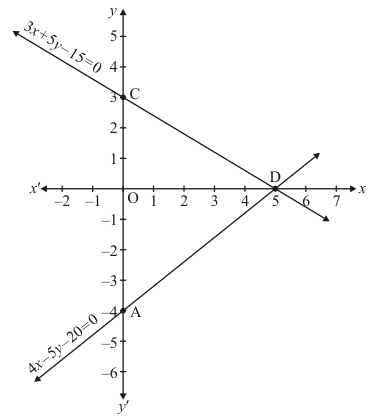
3x + 5y = 15 ....(ii)
Putting x = 0 in equation (ii) we get:
⇒ 3 x 0 + 5y = 15
⇒ y = 3
x = 0, y = 3
Putting y = 0 in equation (ii) we get:
⇒ 3x + 5 x 0 = 15
⇒ x = 5
x = 5, y = 0
Use the following table to draw the graph.
Draw the graph by plotting the two points from table.
The three vertices of the triangle are A(0,-4),B(5,0) and C(0,3)
Hence the solution of the equation is x = 5 and y = 0
Page No 3.31
Q.32. Draw the graphs of the equations 5x − y = 5 and 3x − y = 3. Determine the co-ordinates of the vertices of the triangle formed by these lines and y-axis. Calculate the area of the triangle so formed.
Ans. The given equations are:
5x − y = 5 ....(i)
3x − y = 3 ....(ii)
Putting x = 0 in equation (i) we get:
⇒ 5 x 0 - y = 5
⇒ y = -5
x = 0, y = -5
Putting y = 0 in equation (i) we get:
⇒ 5x - 0 = 5
⇒ x = 1
x = 1, y = 0
Use the following table to draw the graph.
Draw the graph by plotting the two points A(0, - 5), B(1, 0) from table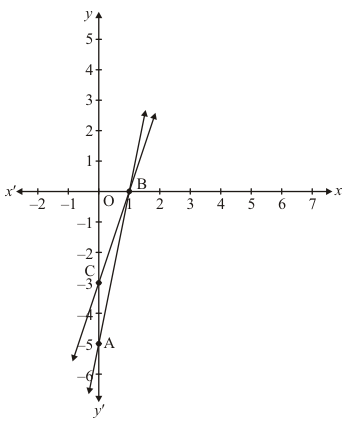
3x - y = 3 ....(ii)
Putting x = 0 in equation (ii) we get:
⇒ 3 x 0 - y = 3
⇒ y = -3
x = 0, y = -3
Putting y = 0 in equation (ii), we get:
⇒ 3x - 0 = 3
⇒ x = 1
x = 1, y = 0
Use the following table to draw the graph.
Draw the graph by plotting the two points C(0,-3), D(1,0) from table.
Hence the vertices of the required triangle are B(1,0),C(0, -3) and A(0, - 5).
Now,
⇒ Required area = Area of PCA
⇒ Required area = 1/2(base x height)
⇒ Required area = 1/2(2 x 1) sq. units
Hence the required area is 1 sq. units
Page No 3.31
Q.33. Form the pair of linear equations in the following problems, and find their solution graphically:
(i) 10 students of class X took part in Mathematics quiz. If the number of girls is 4 more than the number of boys, find the number of boys and girls who took part in the quiz.
(ii) 5 pencils and 7 pens together cost Rs 50, whereas 7 pencils and 5 pens together cost Rs 46. Find the cost of one pencil and a pen.
(iii) Champa went to a 'sale' to purchase some pants and skirts. When her friends asked her how many of each she had bought, she answered, "The number of skirts is two less than twice the number of pants purchased. Also the number of skirts is four less than four times the number of pants purchased." Help her friends to find how many pants and skirts Champa bought.
Ans. (i) Let the number of girls be x and the number of boys be y.
According to the question, the algebraic representation is
x + y = 10
x − y = 4
For x + y = 10,
x = 10 − y
For x − y = 4,
x = 4 + y
Hence, the graphic representation is as follows.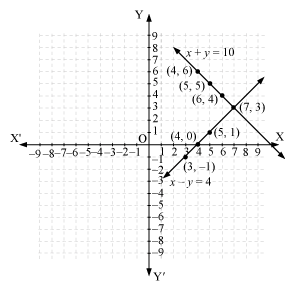
From the figure, it can be observed that these lines intersect each other at point (7, 3).
Therefore, the number of girls and boys in the class are 7 and 3 respectively.
(ii) Let the cost of 1 pencil be Rs x and the cost of 1 pen be Rs y.
According to the question, the algebraic representation is
5x + 7y = 50
7x + 5y = 46
For 5x + 7y = 50,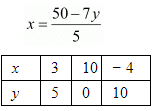
7x + 5y = 46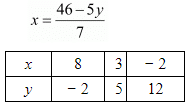
Hence, the graphic representation is as follows.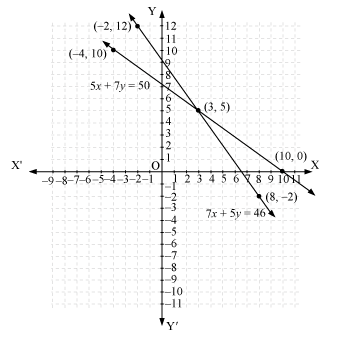
From the figure, it can be observed that these lines intersect each other at point (3, 5).
Therefore, the cost of a pencil and a pen are Rs 3 and Rs 5 respectively.
(iii) Let us denote the number of pants by x and the number of skirts by y. Then the equations formed are :
y = 2x − 2 … (i)
y = 4x − 4 … (ii)
The graphs of the equations (i) and (ii) can be drawn by finding two solutions for each of the equations. They are given in the following table.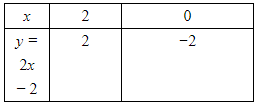
Hence, the graphic representation is as follows.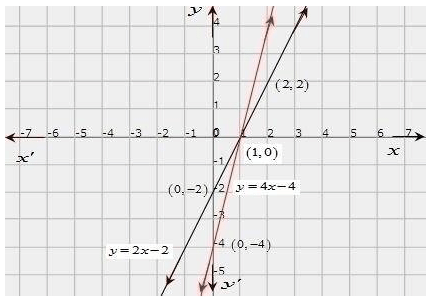
The two lines intersect at the point (1, 0). So, x = 1, y = 0 is the required solution of the pair of linear equations, i.e., the number of pants she purchased is 1 and she did not buy any skirt.
Q.34. Solve the following system of equations graphically:
Shade the region between the lines and the y-axis
(i) 3x − 4y = 7
5x + 2y = 3
(ii) 4x − y = 4
3x + 2y = 14
Ans. The given equations are:
3x − 4y = 7 .....(i)
5x + 2y = 3 ....(ii)
Putting x = 0 in equation (i) we get:
⇒ 3 x 0 - 4y = 7
⇒ y = -7/4
x = 0, y = -7/4
Putting y = 0 in equation (i) we get:
⇒ 3x - 4 x 0 = 7
⇒ x = 7/3
x = 7/3, y = 0
Use the following table to draw the graph.
Draw the graph by plotting the two points A(0,-7/4),B(7/3,0) from table.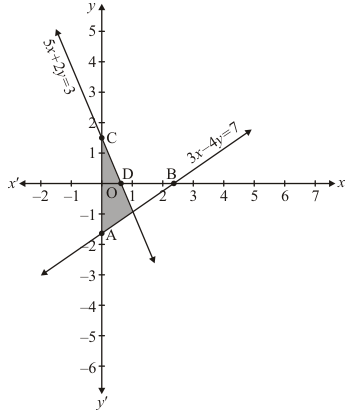
5x + 2y = 3 .....(i)
Putting x = 0 in equation (ii) we get:
⇒ 5x x 0 + 2y = 3
⇒ y = 2/3
x = 0, y = 3/2
Putting y = 0 in equation (ii) we get:
⇒ 5x + 2 x 0 = 3
⇒ x = 3/5
x = 3/5, y = 0
Use the following table to draw the graph.
Draw the graph by plotting the two points A(0,-7/4), B(7/3,0) from table.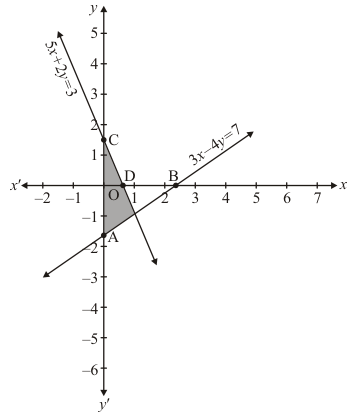
5x + 2y = 3 .....(i)
Putting x = 0 in equation (ii) we get:
⇒ 5 x 0 + 2y = 3
⇒ y = 2/3
x = 0, y = 3/2
Putting y = 0 in equation (ii) we get:
⇒ 5 x 0 + 2 y = 3
⇒ y = 2/3
x = 0, y = 3/2
Putting y =0 in equation (ii) we get:
⇒ 5x + 2 x 0 = 3
⇒ x = 3/5
x = 3/5, y = 0
Use the following table to draw the graph.
Draw the graph by plotting the two points C(0,3/2) and D(3/5,0) from table.
The two lines intersect at points P(1, - 1) of y - axis.
Hence, x = 1 and y = -1 is the Solution.
(ii) The equations are:
4x - y = 4 .....(i)
3x + 2y = 14 .....(ii)
Putting x = 0 in equation (1) we get:
⇒ 4 x 0 - y = 4
⇒ y = -4
x = 0, y = -4
Putting y = 0 in equation (1) we get:
⇒ 4x - 0 = 4
⇒ x = 1
x = 1, y = 0
Use the following table to draw the graph:
Draw the graph by plotting the two points A(0,-4) and B(1,0) from table.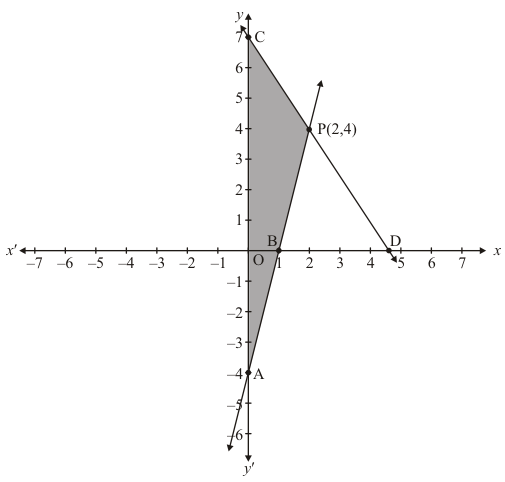
3x + 2y = 14 .....(2)
Putting x = 0 in equation (2) we get:
⇒ 3 x 0 + 2y = 14
⇒ y = 7
x = 0, y = 7
Putting y = 0 in equation (2) we get:
⇒ 3x + 2 x 0 = 14
⇒ x = 14/3
⇒ 14/3, y = 0
Use the following table to draw the graph.
Draw the graph by plotting the two points C(0,7), D(14/3,0) from table.
Two lines intersect at points P(2,4) of y−axis.
Hence x = 2 and y = 4 is the solution.
Page No 3.31
Q.35. Represent the following pair of equations graphically and write the coordinates of points where the lines intersects y-axis.
x + 3y = 6
2x − 3y = 12
Ans. The given equations are
x + 3y = 6 .....(i)
2x − 3y = 12 .....(ii)
Putting x = 0 in equation (i) we get:
⇒ 0 + 3y = 6
⇒ y = 2
x = 0, y = 2
Putting y = 0 in equation (i) we get:
⇒ x + 3 x 0 = 6
⇒ x = 6
x = 6, y = 0
Use the following table to draw the graph.
The graph of (i) can be obtained by plotting the two points A(0,2),B(6,0).
2x - 3y = 12 .....(i)
Putting x = 0 in equation (ii) we get:
⇒ 2 x 0 - 3y = 12
⇒ y = -4
x = 0, y = -4
Putting y = 0 in equation (ii) we get:
⇒ 2x - 3 x 0 = 12
⇒ x = 6
x = 6, y = 0
Use the following table to draw the graph.
Draw the graph by plotting the two points C(0,-4), D(6,0) from table.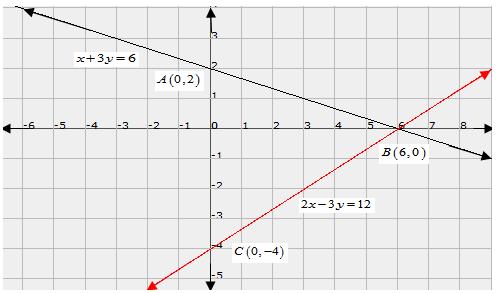
Graph of lines represented by the equations x + 3y = 6, 2x - 3y = 12 meet y−axis at A(0,2),C(0,-4) respectively.
Page No 3.31
Q.36. Given the linear equation 2x + 3y − 8 = 0, write another linear equation in two variables such that the geometrical representation of the pair so formed is
(i) intersecting lines
(ii) Parallel lines
(iii) coincident lines
Ans. (i) For intersecting lines,
Equation of another intersecting line to the given line is−
2x + 5y - 3 = 0
Since, condition for intersecting lines and unique solution is−
(ii) For parallel lines,
Equation of another parallel line to the given line is−
2x + 3y - 3 = 0
Since, condition for parallel lines and no solution is−
(iii) For co−incident lines,
Equation of another coincident line to the given line is−
4x + 6y - 16 = 0
Since, condition for coincident lines and infinite solution is−
FAQs on Chapter 3 - Pair Of Linear Equations In Two Variables, RD Sharma Solutions - (Part-11) - RD Sharma Solutions for Class 10 Mathematics
| 1. How do you determine if a given pair of linear equations in two variables have a unique solution, no solution, or infinitely many solutions? |  |
| 2. Can a pair of linear equations in two variables have more than one solution? |  |
| 3. How can we solve a system of linear equations in two variables when the equations are not in standard form? |  |
| 4. Is it possible for a pair of linear equations in two variables to have a solution that is not a point on the coordinate plane? |  |
| 5. Can we solve a system of linear equations in two variables using only graphical methods? |  |

|
Explore Courses for Class 10 exam
|

|


