Stress-Strain Diagrams | Engineering Materials - Mechanical Engineering PDF Download

Introduction
- The Stress-Strain curve is the curve obtained by plotting the stress-strain behavior obtained by the stress-strain relationship. Each material has a unique curve. Several properties are revealed by the curve (like Modulus of Elasticity, E).
- We get the Stress-Strain curves by drawing on a graph, a curve obtained from the data of a tensile test of a specimen. Changes in length can be observed and are recorded by strain measuring devices on the application of load.
Stress-Strain Diagram for a Ductile Material (Mild Steel)
The material extends elastically at the beginning of the tensile test. There is an increase in strain (both longitudinal and lateral) at first proportional to the stress and the sample comes back to its original length on the removal of the stress. Proportionality limit is the stage up to which the specimen, i.e. Hooke’s law is obeyed by the material perfectly.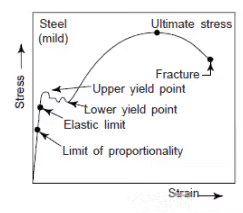
- Further increment of the applied stress, i.e., beyond the elastic limit, produces plastic deformation hence a permanent extension remains even after the removal of the applied load.
- The strain produced in this stage begins to increase more rapidly than the corresponding stress and continues to increase till the yield point is attained. At the yield point the material suddenly stretches.
- The ratio of the load applied to the initial cross-sectional area is called the normal stress and this increases continuously with elongation because of work hardening or strain hardening until the maximum tensile stress.
- The value of stress at maximum load obtained by dividing the maximum load by the original cross-sectional area is called ultimate tensile stress.
- The phenomenon of slow extension increasing with time, at constant stress, is termed at creep. It can be observed by continuous increases of strain at a slow rate without any further increase of stress or loading. Development of neck can be seen at this point, along the length of the specimen and plastic deformation is localized within the neck when loaded further. There is a decrease in cross-sectional area in proportion to the increasing length during elastic elongation. The volume of the specimen is same and the cross sectional area decreases in proportion to the increasing length.
Stress-Strain Diagram for a Brittle Material
For a mild steel specimen, the limit of proportionality, elastic limit, yield point, ultimate tensile stress and fracture stress at the breaking points can be clearly seen. A well-defined yield point can be clearly seen in this diagram. In case of brittle materials, yield point is not clearly defined as shown in the following figure.
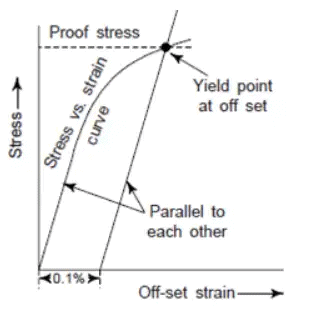
- The yield strength in such materials can be determined by following the general practice. A straight line parallel to the elastic portion of the stress-strain curve at a carefully selected of strain ordinate value (say 0.1%). The point of intersection of this line with the stress vs strain curve is the yield point at an off-set and this is called the yield strength at 0.1% or 0.2% of set strain.
Note:
- Higher value of angle of inclination of the line of stress vs. strain proportionality indicates that the metal is more elastic.
- Greater hardness is usually revealed by materials showing higher yield point.
- If the maximum stress point shows a higher value, then that material is a stronger one.
- The brittleness and toughness of materials are shown by the distance from the ordinates of the breaking stress or load point. The material is brittle when the distance is shorter.
Stress-Strain diagram for Cemented tungsten carbide: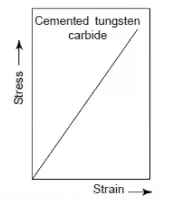
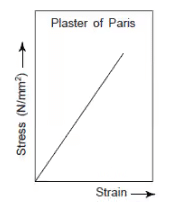
Stress-Strain diagram for Plaster of Paris:
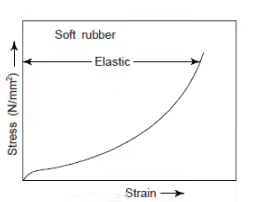
Stress-Strain diagram for Soft rubber:
Engineering and True Stress-Strain Diagrams
When the calculation of the stress is based on the original area, it is known as the engineering or nominal stress. If the calculation of the stress is based upon the instantaneous area at any instant of load, then it is known as true stress. If the original length is used for the calculation of the strain, then it is called the engineering strain.

Some Properties of Material:
- Brittleness
(i) Defined as the property of a material that causes fracture without any appreciable deformation.
(ii) Exactly opposite to the ductility of a metal.
(iii) Example: glass, concrete, and Cast Iron.
(iv) Materials with less than 5% elongation are considered brittle materials. - Toughness
(i) Defined as the property of a material that enables it to absorb maximum energy before the occurrence of fracture.
(ii) Calculation of toughness is done on the basis of area under the stress-strain curve.
(iii) Twisting, bending and stretching of a material before failure, all are made possible by the property of toughness.
(iv) With the rise in temperature, the value of toughness falls.
(v) For structural properties which have to withstand shock and vibration, toughness is a desirable property.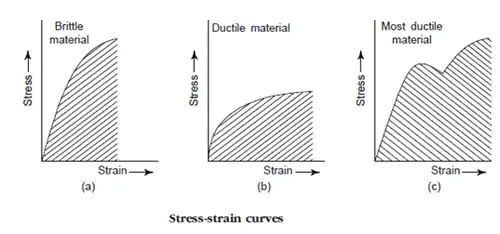
- Stiffness
(i) The property of a material which enables resistance against deformation.
(ii) Stiffness and flexibility are opposite to each other.
(iii) If the materials undergo little deformation under high load, then it has high stiffness. - Resilience
(i) The property of a material which enables it to store energy and resists shocks or impacts.
(ii) Amount of energy absorbed per unit volume, in stressing a material up to elastic limit is the measure of Resilience.
(iii) This property plays a significant role in the selection of a material used for various types of springs. - Endurance
(i) Property of a material which enables it to withstand varying stresses (same or opposite nature).
(ii) Endurance limit is the maximum value of stress, which can be applied for an indefinite time without causing its failure.
(iii) This property plays a significant role in the selection of materials for design and production of parts in reciprocating machines and components subjected to vibrations. - An-elastic Behaviour
(i) An-elastic behavior is the recoverable deformation that occurs as a function of time.
(ii) Because of some relaxation process present inside the material, elastic deformation of the material goes on even after the application of the load.
(iii) Upon removing the load, a part of the elastic deformation is recovered only as a function of time, with the reversal of the relaxation process. - Viscoelastic Behavior
(i) Present in those materials which give response to an applied stress by both recoverable and permanent time-dependent deformations.
(ii) This behavior is exhibited by non-crystalline organic polymers.
(iii) Permanent time dependent deformation is termed as viscous flow.(iv) This is analogous to the creep phenomenon in crystalline materials.
|
15 videos|35 docs|13 tests
|
FAQs on Stress-Strain Diagrams - Engineering Materials - Mechanical Engineering
| 1. What is a stress-strain diagram in mechanical engineering? |  |
| 2. How is a stress-strain diagram obtained? | |
| 3. What does the elastic region on a stress-strain diagram represent? | |
| 4. What does the yield point on a stress-strain diagram indicate? | |
| 5. What does the ultimate strength on a stress-strain diagram represent? | |


MCQs
,Extra Questions
,Important questions
,Free
,Exam
,Semester Notes
,Stress-Strain Diagrams | Engineering Materials - Mechanical Engineering
,ppt
,shortcuts and tricks
,video lectures
,mock tests for examination
,Previous Year Questions with Solutions
,Objective type Questions
,Stress-Strain Diagrams | Engineering Materials - Mechanical Engineering
,Sample Paper
,past year papers
,Viva Questions
,Summary
,Stress-Strain Diagrams | Engineering Materials - Mechanical Engineering
,practice quizzes
,study material
;


Stress-Strain Diagrams Free PDF Download
Importance of Stress-Strain Diagrams
Stress-Strain Diagrams Notes
Stress-Strain Diagrams Mechanical Engineering Questions
Study Stress-Strain Diagrams on the App
|
© EduRev
|
Education Revolution
|


|


within 7 days!