In questions 1 to 10, there are four options out of which one is correct.
Write the correct answer.
Q.1. Comparison of parts of a whole may be done by a
(a) Bar graph
(b) pie chart
(c) linear graph
(d) line graph
Ans: b
Solution: A pie chart is used to compare the parts of a whole. Because the circle represents the whole.
Q.2. A graph that displays data that changes continuously over periods of time is
(a) Bar graph
(b) pie chart
(c) histogram
(d) line graph
Ans: d
Solution: A line graph displays the continuous change of data over the period of time like speed or distance covered.
Q.3. In the given graph the coordinates of point x are
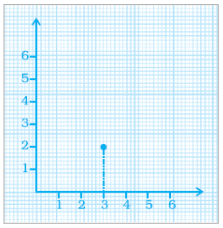
(a) (0, 2)
(b) (2, 3)
(c) (3, 2)
(d) (3, 0)
Ans: c
Solution: To find the coordinate, draw the perpendicular line from point x to the x axis and y from the y axis. From the given figure, the coordinate of x axis is 3, and the coordinate of y-axis is 2.
Hence, the coordinate of x is (3, 2)
Q.4. In the given graph the letter that indicates the point (0, 3) is
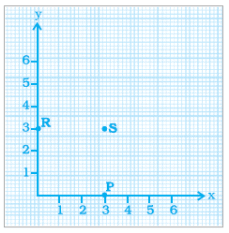
(a) P
(b) Q
(c) R
(d) S
Ans: c
Solution: From the given figure, the coordinates of S is (3, 3), the coordinates of P is (3, 0) and Coordinates of R is (0, 3)
Hence, option c is correct.
Q.5. The point (3, 4) is at a distance of
(a) 3 from both the axis
(b) 4 from both the axis
(c) 4 from the x axis and 3 from y axis
(d) 3 from x axis and from y axis
Ans: c
Solution: In the coordinate (3, 4), the first number represents the distance on x axis or y coordinate whereas the second number 4 represents the distance on y axis or the x coordinate.
Q.6. A point which lies on both the axis is ______.
(a) (0, 0)
(b) (0, 1)
(c) (1, 0)
(d) (1, 1)
Ans: a
Solution: Both the x axis and y axis are perpendicular to each other and they meet at a single point called origin (0, 0)
Q.7. The coordinates of a point at a distance of 3 units from the x axis and 6 units from the y axis is
(a) (0, 3)
(b) (6, 0)
(c) (3, 6)
(d) (6, 3)
Ans: d
Solution: It is known that, the distance from the x axis gives the y coordinate and the distance from the y axis gives the x coordinate. Hence, the coordinate point is (6, 3).
Q.8. In the given figure the position of the book on the table may be given by
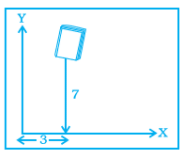
(a) (7, 3)
(b) (3, 7)
(c) (3, 3)
(d) (7, 7)
Ans: b
Solution: The book positioned at a distance of 3 units from the y axis and 7 units from the x axis. Hence, the required coordinate point is (3, 7).
Q.9. Data was collected on a student's typing rate and graph was drawn as shown below. Approximately how many words had this student typed in 30 seconds?
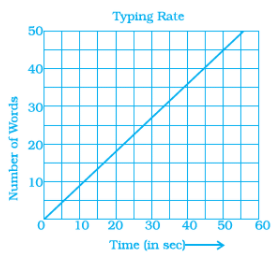
(a) 20
(b) 24
(c) 28
(d) 34
Ans: c
Solution: From the given graph, the time (in sec) is taken in x axis and the number of words in y axis. When the look for the line graph to find the number of words corresponds to 30 seconds in the x axis, the words typed in 30 seconds comes out is approximately 28 words.
Q.10. Which graphs of the following represent the table below?
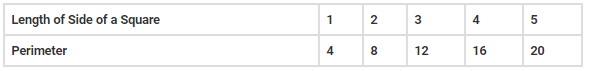
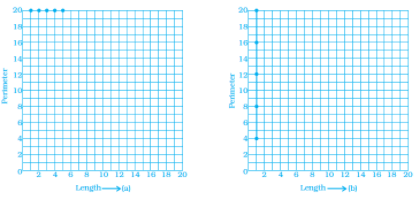
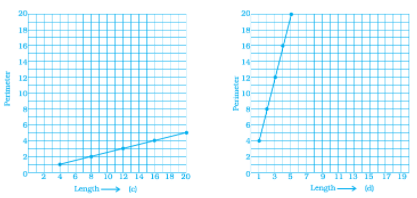
Ans: d
Solution: It is given that, x axis represents the length of the square side and y axis represents the perimeter. When you plot the given points in the graph, the answer should be option (d).
In questions 11 to 25, fill in the blanks to make the statements true.
Q.11. __________ displays data that changes continuously over periods of time.
Ans: Line Graph
Line graph displays the relationship between the constantly varying quantities
Q.12. The relation between dependent and independent variables is shown through a _______.
Ans: Graph
The graph defines the relationship between the two variables where one is the dependent variable and the other one is the independent variable.
Q.13. We need _______ coordinates for representing a point on the graph sheet.
Ans: two (a pair)
To represent the point on the graph we need a pair of coordinate, where one represents the x coordinate and the other represents the y coordinate.
Q.14. A point in which the x-coordinate is zero and y-coordinate is nonzero will lie on the ________.
Ans: y axis
The point lies on the y axis, when the x coordinate is zero.
Q.15. The horizontal and vertical line in a line graph are usually called _______ and ______.
Ans: x axis and y axis
Q.16. The process of fixing a point with the help of the coordinates is known as ______ of the point.
Ans: Plotting
The process of fixing the point using the coordinates is known as the plotting of points on a graph.
Q.17. The distance of any point from the y-axis is the _______coordinate.
Ans: x coordinate
The distance of any point from the x axis is called y coordinate and the distance of any point from the y axis is called the x coordinate.
Q.18. All points with y-coordinate as zero lie on the ______.
Ans: x axis
When all the points on the y coordinate are zero, then absolutely all the points lie on the x axis.
Q.19. For the point (5, 2), the distance from the x -axis is ______ units.
Ans: 2 units
We know that, y coordinate represents the distance from the x axis. So the answer is 2 units.
Q.20. The x-coordinate of any point lying on the y-axis will be ______. zero (0)
Ans: When the x-coordinates lies on the y axis, then the x coordinate of any point on the y axis should be zero.
Q.21. The y-coordinate of the point (2, 4) is ________.
Ans: 4 units.
In the ordered pair, the first number always represents the x coordinate and the second number represents the y coordinate. Hence, the y coordinate is 4 units.
Q.22. In the point (4, 7), 4 denotes the _______.
Ans: x- coordinate.
The first number in the ordered pair represents the x coordinate and the second number represents the y- coordinate.
Q.23. A point has 5 as its x - coordinate and 4 as its y-coordinate. Then the coordinates of the point are given by ______.
Ans: (5, 4)
The point is represented using the ordered pair = (x coordinate, y coordinate)
Q.24. In the coordinates of a point, the second number denotes the _______.
Ans: y coordinate
The second number in the coordinate point represent the y coordinate.
Q.25. The point where the two axes intersect is called the _______.
Ans: Origin (0, 0)
The two axis intersects at a common point in the graph is called the origin.
In the questions 26 to 34, state whether the statements are true (T) or false (F).
Q.26. For fixing a point on the graph sheet we need two coordinates.
Ans: True
For plotting a point, we need two coordinates such as x coordinate and y coordinate.
Q.27. A line graph can also be a whole unbroken line.
Ans: False
A graph which has whole unbroken lines are called linear graph.
Q.28. The distance of any point from the x -axis is called the x-coordinate.
Ans: False
The distance of any point from the x -axis is called the y-coordinate
Q.29. The distance of the point (3, 5) from the y-axis is 5.
Ans: False
The distance of the point (3, 5) from the y-axis is 3 and from x axis is 5
Q.30. The ordinate of a point is its distance from the y-axis.
Ans: False
The ordinate is also known as y coordinate, where it is defined as a distance from the x axis
Q.31. In the point (2, 3), 3 denotes the y-coordinate.
Ans: True
From the given point,
(2, 3) = (x coordinate, y coordinate)
Q.32. The coordinates of the origin are (0, 0).
Ans: True
Both the axis such as x axis and y axis intersects at each other when the coordinates of x and y are 0 and 0 respectively.
Q.33. The points (3, 5) and (5, 3) represent the same point.
Ans: False
The point (3, 5) and (5, 3) does not represent the same point.
From point (3, 5), the x coordinate is 3 and the y coordinate is 5
From point (5, 3), the x coordinate is 5 and the y coordinate is 3
When these points are plotted in graph, you will get the different graph.
Q.34. The y-coordinate of any point lying on the x -axis will be zero.
Ans: True
For any y coordinate point, when it lies on the x axis, then the y coordinate should be zero. For example, (5, 0) and (7, 0), when these points are plotted in the graph, both the points will lie on the x axis.
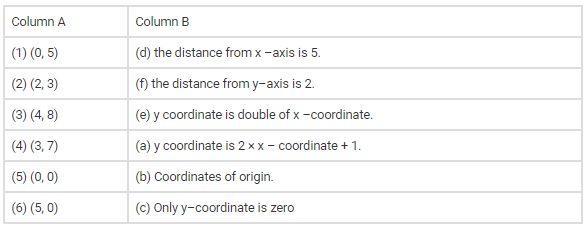
Q.35. Match the coordinates given in Column A with the items mentioned in Column B.
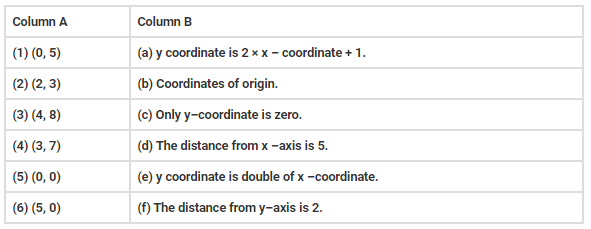
Ans:
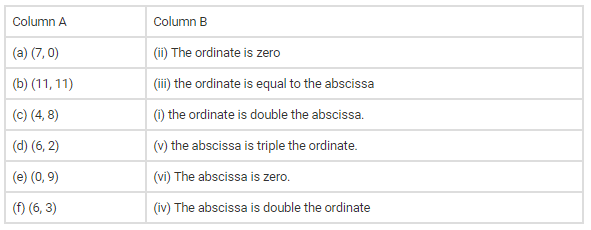
Q.36. Match the ordinates of the points given in Column A with the items mentioned in Column B.
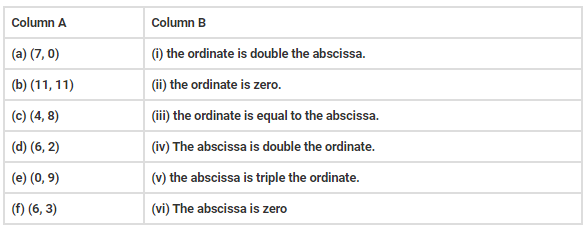
Ans: Here, x coordinate represents the abscissa and y coordinate represents the ordinate.
Q.37. From the given graph, choose the letters that indicate the location of the points given below.
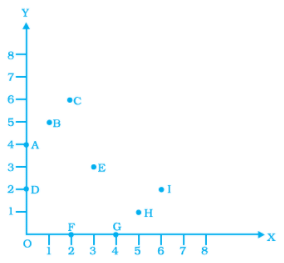
(a) (2, 0)
(b) (0, 4)
(c) (5, 1)
(d) (2, 6)
(e) (3,3)
Ans: From the given graph, the letters that indicate the location of point is given below:
A indicates the points: (0, 4)
B indicates the points: (1, 5)
C indicates the points: (2, 6)
D indicates the points: (0, 2)
E indicates the points: (3, 3)
F indicates the points: (2, 0)
Q.38. Find the coordinates of all letters in the graph given below.
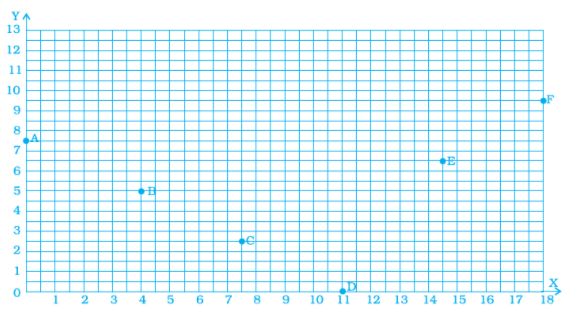
Ans: From the given graph, the coordinates of the given letters are:
A Coordinates = (0, 7.5)
B Coordinates = (4, 5)
C Coordinates = (7.5, 2.5)
D Coordinates = (11, 0)
E Coordinates = (14.5, 6.5)
F Coordinates = (18, 9.5)
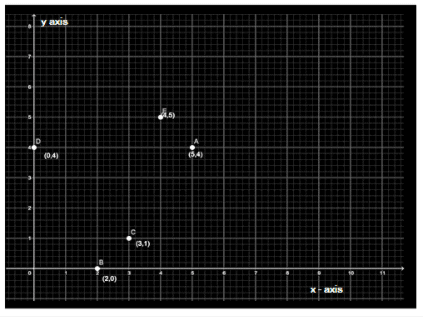
Q.39. Plot the given points on a graph sheet.
(a) (5, 4)
(b) (2, 0)
(c) (3, 1)
(d) (0, 4)
(e) (4,5)
Ans: First draw the x and y axis, and plot the given points.
The given points are A = (5, 4), B = (2, 0), C = (3, 1), D = (0, 4) and E = (4, 5)
Q.40. Study the given map of a zoo and answer the following questions.
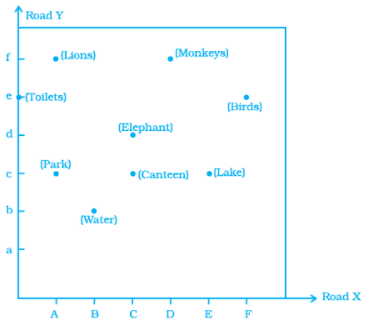
(a) Give the location of lions in the zoo.
(b) (D, f) and (C, d) represent locations of which animals in the zoo?
(c) Where are the toilets located?
(d) Give the location of canteen.
Ans:
(a) The location of lions in the zoo is (A, f)
(b) (D, f) and (C, d) represent locations of Monkey and elephant respectively
(c) The toilets are located in (0, e)
(d) The location of the canteen is (C, c)
Q.41. Write the x -coordinate (abscissa) of each of the given points.
(a) (7, 3)
(b) (5, 7)
(c) (0, 5)
Ans: We know that, abscissa represents the x coordinate in the ordered pair.
For the given points, the abscissa are as follows:
(a) (7, 3) - 7 is the abscissa
(b) (5, 7) - 5 is the abscissa
(c) (0, 5) - 0 is the abscissa
Q.42. Write the y-coordinate (ordinate) of each of the given points.
(a) (3, 5)
(b) (4, 0)
(c) (2, 7)
Ans: We know that, the ordinate represents the y coordinate in the ordered pair.
For the given points, the ordinate are as follows:
(a) (3, 5) - 5 is the ordinate
(b) (4, 0) - 0 is the ordinate
(c) (2, 7) - 7 is the ordinate
Q.43. Plot the given points on a graph sheet and check if the points lie on a straight line. If not, name the shape they form when joined in the given order.
(a) (1, 2), (2, 4), (3, 6), (4, 8).
(b) (1, 1), (1, 2), (2, 1), (2, 2).
(c) (4, 2), (2, 4), (3, 3), (5, 4).
Ans: (a) For the given points, (1, 2), (2, 4), (3, 6), (4, 8), the obtained graph is given below:
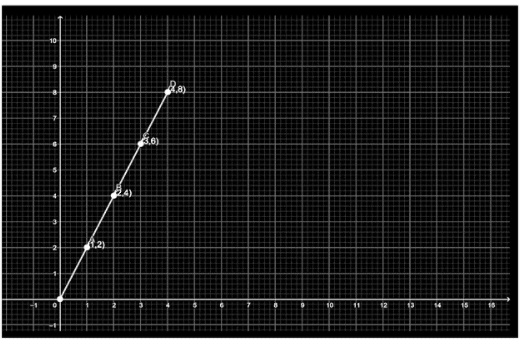
All the points lie on the straight line.
(b) For the given points, (1, 1), (1, 2), (2, 1), (2, 2), the obtained graph is given below:
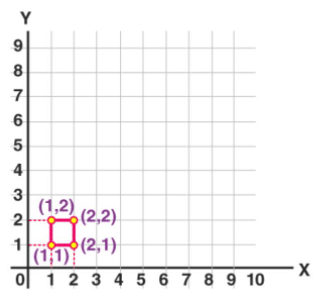
No, the points do not form a straight line. They form a square.
(c) For the given points, (4, 2), (2, 4), (3, 3), (5, 4), the obtained graph is given below:
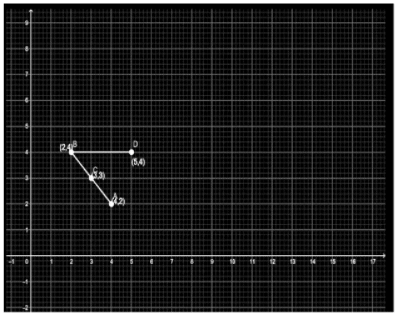
The given points do not lie in a straight line. When the points are joined in the given order (also AD), a triangle is formed.
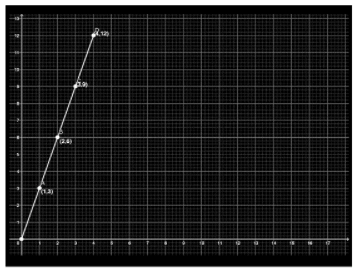
Q.44. If y-coordinate is 3 times x -coordinate, form a table for it and draw a graph.
Ans: Given that y = 3x
Let x = 1, 2, 3, 4
The corresponding y coordinate values are given as follows:
When x = 1, y= 3(1) = 3 ⇒ (1, 3)
When x = 2, y= 3(2) = 6 ⇒ (2, 6)
When x = 3, y= 3(3) = 9 ⇒ (3, 9)
When x = 4, y= 3(4) = 12 ⇒ (4, 12)
Hence, the obtained points are:
(1, 3), (2, 6), (3, 9) and (4, 12)
The graph for the above given points are:
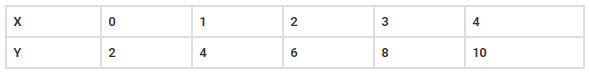
Q.45. Make a line graph for the area of a square as per the given table
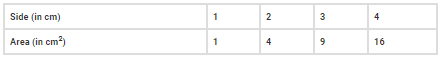
Is it a linear graph?
Ans: From the given table, the coordinates are taken as:
(1, 1), (2, 4), (3, 9), (4, 16)
The graph for the given points are:
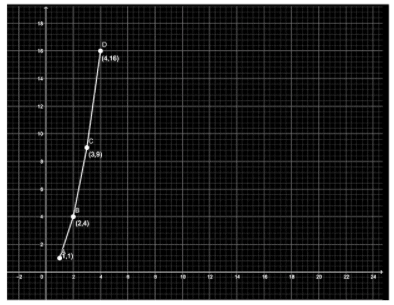
Here, x axis represents the square side and y axis represents the area of a square.
From the given graph, it is shown that, it is not a linear graph, because the points are not in the same line (not collinear).
Hence, it is not a linear graph.
Q.46. The cost of a note book is Rs. 10. Draw a graph after making a table showing cost of 2, 3, 4 ... Note books. Use it to find
(a) The cost of 7 notebooks.
(b) The number of note books that can be purchased with Rs 50.
Ans: It is given that, the cost of one note book is Rs.10
(a) Hence, the cost of 7 note books is 7×10 = 70 rs
(b) To find the number of note books that can be purchased for Rs. 50 is
= 50/10
= 5
Hence, the number of note books for Rs. 50 is 5.
Q.47. Explain the situations represented by the following distance-time graphs.
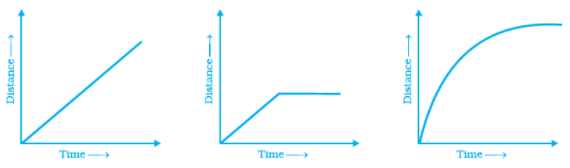
Ans: (a) The first figure shows that, the distance increases time also increase with equal intervals
(b) The second figure shows that, the distance increases time also increases and the remaining part shows that the distance is constant for a long time.
(c) The third figure shows that, distance increases times also increases unequal intervals.
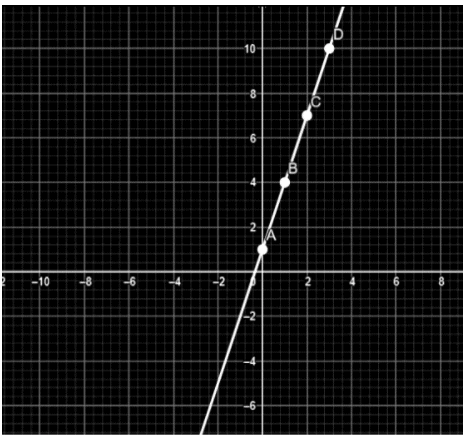
Q.48. Complete the given tables and draw a graph for each.
(a) 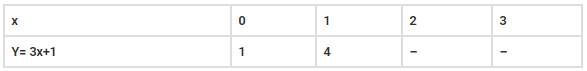
(b) 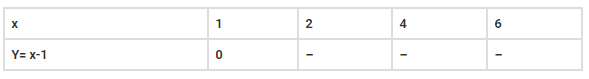
Ans: (a) It given that, y= 3x+1
When x= 0, then y = 1
When x=1, then y = 4
Now, we have to find the value of y, when x= 2 and x = 3
When x= 2, y = 3(2) +1 = 7
When x= 3, y = 3(3) +1 = 10
Hence, the obtained coordinate points are:
(0, 1), (1, 4), (2, 7) and (3, 10)
The graph for the given points is:
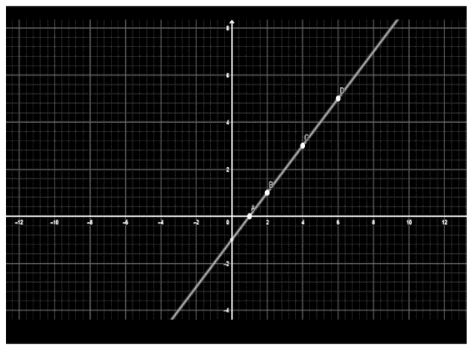
(b) It given that, y= x-1
When x= 1, then y = 0
Now, we have to find the value of y when x= 2, 4, 6,
When x= 2, y = 2 -1 = 1
When x= 4, y = 4- 1 = 3
When x= 6, y = 6- 1 = 5
Hence, the obtained coordinate points are:
(1, 0), (2, 1), (4, 3) and (6, 5)
The graph for the given points is:
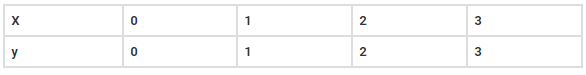
Q.49. Study the given graphs (a) and (b) and complete the corresponding tables below
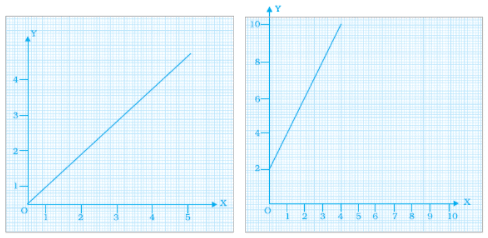
(a) 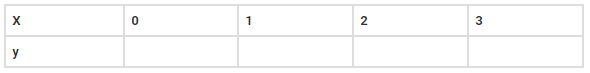
(b) 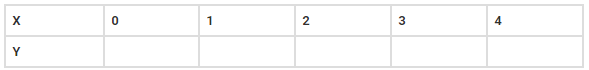
Ans: (a) From the given graph, the y coordinates of the first table is given as:
Let take x = 1, now draw a line parallel to y axis at 1, and check whether where it cuts the graph. So we get y= 4
Similarly for other x values, repeat the procedure.
Then the coordinates are given the table as follows:
(b) From the given graph, the y coordinates of the first table is given as:
Let take x = 1, now draw a line parallel to y axis at 1, and check whether where it cuts the graph. So we get y=1
Similarly for other x values, repeat the procedure.
Then the coordinates are given the table as follows:
Q.50. Draw a graph for the radius and circumference of circle using a suitable scale.
(Hint: Take radius = 7, 14, 21 units and so on)
From the graph,
(a) Find the circumference of the circle when radius is 42 units.
(b) At what radius will the circumference of the circle be 220 units?
Ans: We know that, the circumference of a circle is 2πr. The radius depends on the circumference of a circle.
So, now we have to plot the radius on the x axis and the circumference on the y axis. Because radius is an independent variable and circumference is a dependent variable.
Now, the equations in terms of x and y is given as:
y = 2πx
When x= 0, then y = 2π (0) = 0
When x= 7, then y = 2π (7) = 44
When x= 14, then y = 2π (14) = 88
When x= 21, then y = 2π (21) = 132
Hence, the coordinates are (0, 0), (7, 44, (14, 88) and (21, 132)
The graph of the points are:
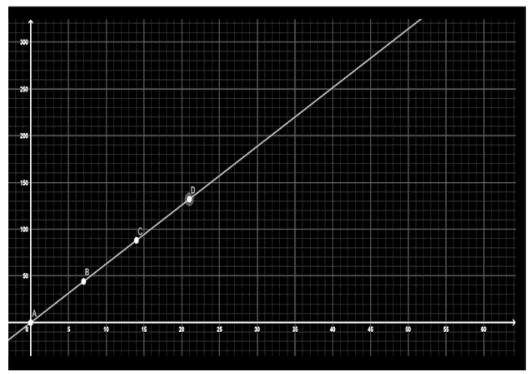
(a) When the radius is 42 units, from the graph, the value of y (circumference) is 264.
(b) From the graph, it is obtained that when the circumference is 220, the value of radius is 35 units.


