CTET & State TET Exam > CTET & State TET Notes > Mathematics & Pedagogy Paper 2 for CTET & TET Exams > NCERT Summary: Data Handling
NCERT Summary: Data Handling

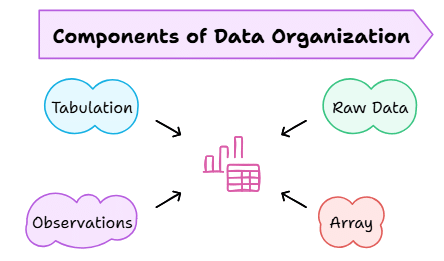
Data
- A data is a collection of numbers gathered to give some information.
- Raw data: Data obtained in the original form is called raw data.
- Array: Arranging the numerical figures in an ascending or a descending order is called an array
- Observations: Each numerical figure in a data is called an observation.
- Tabulation of data : Arranging the data in a systematic tabular form is called tabulation or presentation of the data.
Recording and Organising Data
- Data can be collected from different sources.
- Ekta is asked to collect data for size of shoes of students in her Class VI. Her finding are recorded in the manner shown below:
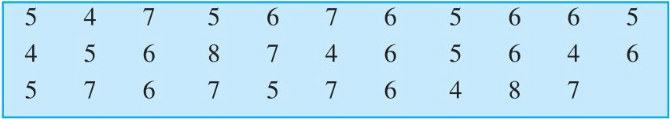
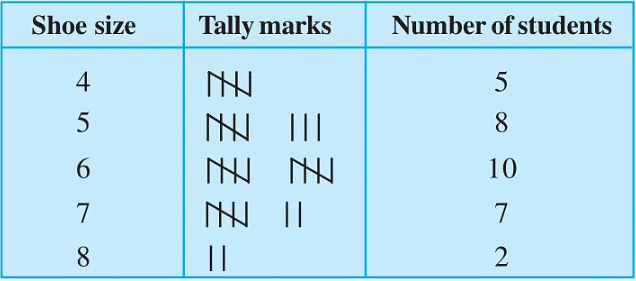
Ekta prepared a table using tally marks.
Pictograph
- A pictograph represents data through pictures of objects. It helps answer the questions on the data at a glance.
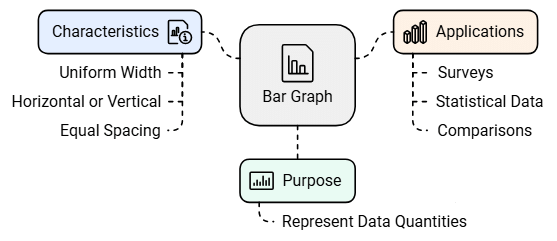
A Bar Graph
- Bars of uniform width can be drawn horizontally or vertically with equal spacing between them and then the length of each bar represents the given number. This method of representing data is called a bar diagram or a bar graph.
The document NCERT Summary: Data Handling is a part of the CTET & State TET Course Mathematics & Pedagogy Paper 2 for CTET & TET Exams.
All you need of CTET & State TET at this link: CTET & State TET
FAQs on NCERT Summary: Data Handling
| 1. What is data handling in statistics? |  |
Ans.Data handling in statistics refers to the process of collecting, organizing, representing, and interpreting data. It involves methods to summarize data and make it easy to understand, allowing for better decision-making based on the information gathered.
| 2. Why is data representation important? | |
Ans.Data representation is important because it helps to visualize data in a clear and concise manner. Techniques like graphs, charts, and tables make it easier to identify trends, patterns, and relationships within the data, aiding in effective communication and analysis.
| 3. What are the different types of data? | |
Ans.There are two main types of data: qualitative and quantitative. Qualitative data refers to descriptive information that cannot be measured (e.g., colors, names), while quantitative data refers to numerical information that can be measured and analyzed (e.g., height, weight).
| 4. How can we calculate the mean of a data set? | |
Ans.To calculate the mean of a data set, you add all the values together and then divide the sum by the total number of values. The formula is: Mean = (Sum of all values) / (Number of values).
| 5. What is the purpose of a bar graph? | |
Ans.The purpose of a bar graph is to represent categorical data visually. It uses bars of different heights or lengths to show the frequency or amount of each category, making it easier to compare different groups within the data.
About this Document

1.1K Views

4.89/5 Rating

Apr 18, 2026 Last updated
Related Exams
Document Description: NCERT Summary: Data Handling for CTET & State TET 2026 is part of Mathematics & Pedagogy Paper 2 for CTET & TET Exams preparation. The notes and questions for NCERT Summary: Data Handling have been prepared according to the CTET & State TET exam syllabus. Information about NCERT Summary: Data Handling covers topics like and NCERT Summary: Data Handling Example, for CTET & State TET 2026 Exam. Find important definitions, questions, notes, meanings, examples, exercises and tests below for NCERT Summary: Data Handling.
Introduction of NCERT Summary: Data Handling in English is available as part of our Mathematics & Pedagogy Paper 2 for CTET & TET Exams for CTET & State TET & NCERT Summary: Data Handling in Hindi for Mathematics & Pedagogy Paper 2 for CTET & TET Exams course. Download more important topics related with notes, lectures and mock test series for CTET & State TET Exam by signing up for free. CTET & State TET: NCERT Summary: Data Handling
Description
NCERT Summary: Data Handling of Mathematics & Pedagogy Paper 2 - covers all the important topics from the book, explained in easy language for better understanding. Free PDF available for download.
Information about NCERT Summary: Data Handling
In this doc you can find the meaning of NCERT Summary: Data Handling defined & explained in the simplest way possible. Besides explaining types of NCERT Summary: Data Handling theory, EduRev gives you an ample number of questions to practice NCERT Summary: Data Handling tests, examples and also practice CTET & State TET tests


Related Searches
MCQs, NCERT Summary: Data Handling, Important questions, mock tests for examination, practice quizzes, Exam, ppt, Objective type Questions, past year papers, pdf , shortcuts and tricks, Free, Previous Year Questions with Solutions, Semester Notes, video lectures, Summary, Viva Questions, Extra Questions, study material, NCERT Summary: Data Handling, Sample Paper, NCERT Summary: Data Handling;