Smart Charts Class 5 Worksheet Maths Chapter 14
Q.1. On which day temperature is maximum?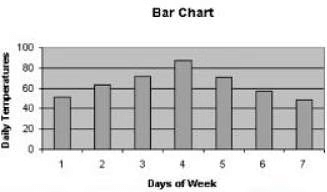
Q.2. Which state has most number of patients?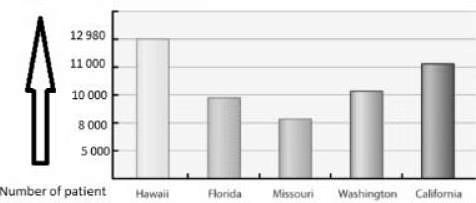
Q.3. Temperature of Delhi is increased by how much from 1 June to 1 December?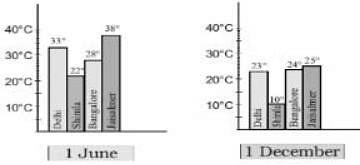
Q.4. How many children help in washing clothes and utensils?
| Help most In house work | Number of children |
| Going to the market | 47 |
| Washing utensils | 15 |
| Washing clothes | 3 |
| Making, serving food | 25 |
| Cleaning the house | 10 |
Q.5. How many rabbits increased from 3 year to 4 year?
| Time | Number of rabbits |
| Start | 10 |
| 1 year | 18 |
| 2 year | 32 |
| 3 year | 58 |
| 4 year | 105 |
Q.6. In which year 14 rabbits increased?
| Time | Number of rabbits |
| Start | 10 |
| 1 year | 18 |
| 2 year | 32 |
| 3 year | 58 |
| 4 year | 105 |
Q.7. Due to some disease 20 rabbits died m year 5, now how many rabbits are there in 4th year?
| Time | Number of rabbits |
| Start | 10 |
| 1 year | 18 |
| 2 year | 32 |
| 3 year | 58 |
| 4 year | 105 |
Q.8. Every year 200 kiwis are increasing in number, if in year 2010 there were 2230 kiwis how many kiwis are there by the end of year 2017?
Q.9. Between which days did the length of the plant change most?
(a) 0 - 4
(b) 4 - 8
(c) 8 - 12
(d) 12 - 16
(e) 16 - 20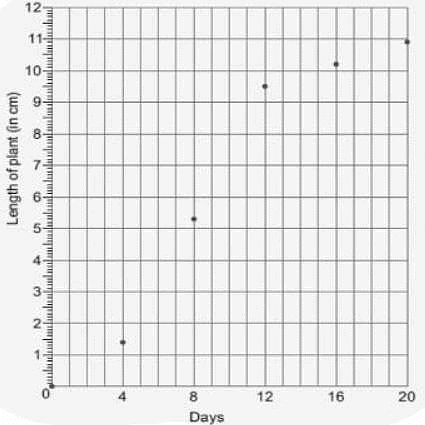
Q.10. Use the above chart and Find out the Length of the Plant after 12 days?
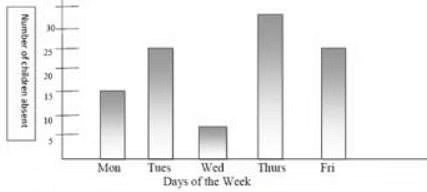
Q.11. Write the number for the siren tally mark. Q.12. Observe the following bar chart and find out how many more children were absent on Thursday than on Monday?
Q.13. Look at the pie chart and find out which is the most popular sports.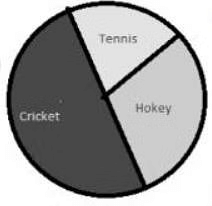
Q.14. Ajay made a Tally chart of the animals, he saw in the zoo. Find out how many cats and goats are there in total?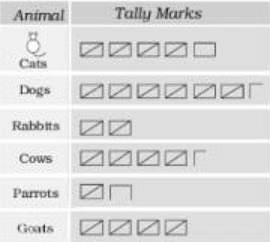 Q.15. Pie chart pets in a farm house is given below, what is the percentage of dogs in farm house?
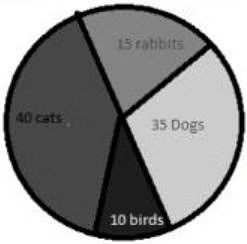 Q.16. Number of panda's in china doubled every year, if there where 200 panda's in year 2011. How many pandas will be there at the end of year 2017?
Q.17. Pie chart of books in library is given below. How many books are there for math and french?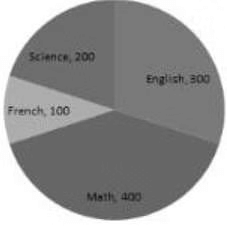
Q.18. Tia observes the pie the chart given below and she says 50% of books in library is filled with science and french, is the right?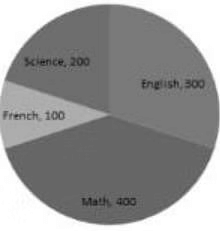
Q.19. How many students watch TV and read books?
| What they like to do after school | Number of children |
| Watching TV | 2 |
| Playing football | 3 |
| Reading story books | 2 |
| Cycling | 1 |
| Playing indoor games | 1 |
| Doing homework | 1 |
Q.20. A special breed of bird triples every year. If there are 200 birds in year 2014 and 50 birds died m year 2016, how many birds will be there at the end of year 2017?
FAQs on Smart Charts Class 5 Worksheet Maths Chapter 14
| 1. What is a smart chart? |  |
| 2. How can a smart chart be created? |  |
| 3. What are the benefits of using smart charts? |  |
| 4. Can smart charts be used for real-time data analysis? |  |
| 5. Are smart charts only used in business settings? |  |


