How to attempt the Writing Task 1 | Writing for Academic IELTS PDF Download
| Table of contents |
|
| What is IELTS Writing Task 1? |
|
| Types of Questions in Writing Task 1 |
|
| How to Answer IELTS Writing Task 1 Question? |
|
| Writing Task 1 Example with Detailed Guidelines |
|

What is IELTS Writing Task 1?
IELTS Writing Task 1 is a part of the IELTS Academic Writing test, where you are given a visual representation of information and asked to describe it in your own words. To excel in the IELTS Writing section, it is essential to understand the exam pattern. The IELTS Writing test consists of two tasks that must be completed within one hour.
- IELTS recommend you spend no more than 20 minutes on writing task 1. However, the time is yours to manage as you wish. You should write over 150 words.
- IELTS writing task 1 is worth about 33%of your total writing marks. You will be marked on:
1. Task Achievement (25%)
2. Coherence & Cohesion (25%)
3. Vocabulary (25%)
4. Grammar (25%)

Types of Questions in Writing Task 1
You will be presented with one of the following graphics:

1. Bar Chart
A bar chart presents data visually using rectangular bars. These bars can either occur horizontally or vertically. You may also be given two charts to summarise and contrast in one task. In writing task 1 of the IELTS academic exam, you will always be given a description of the chart as well as key information you need to understand the chart such as:
- A title and/or statement explaining the chart
- A key/legend that explains the color coding of the chart
- A labelled vertical Y axis
- A labelled horizontal X axis
Example:
2. Line Graph

3. Table Chart
One type of IELTS writing task 1 is a table that presents information in columns and rows.
You may be given one table or two tables. Describing a table in IELTS is the same as describing the bar graph. In the IELTS writing task 1 table chart question, you need to compare and contrast the data that is given. While writing, we need to ensure the table chart vocabulary and that it is unique and engaging.
Example:
4. Pie Chart
You may be presented with a visual representation of data such as a pie chart, and you will be required to describe the information presented in your own words. In a pie chart, then you will need to analyze and interpret the data presented and write a report summarizing the key features of the chart, including any trends or patterns.
Example:

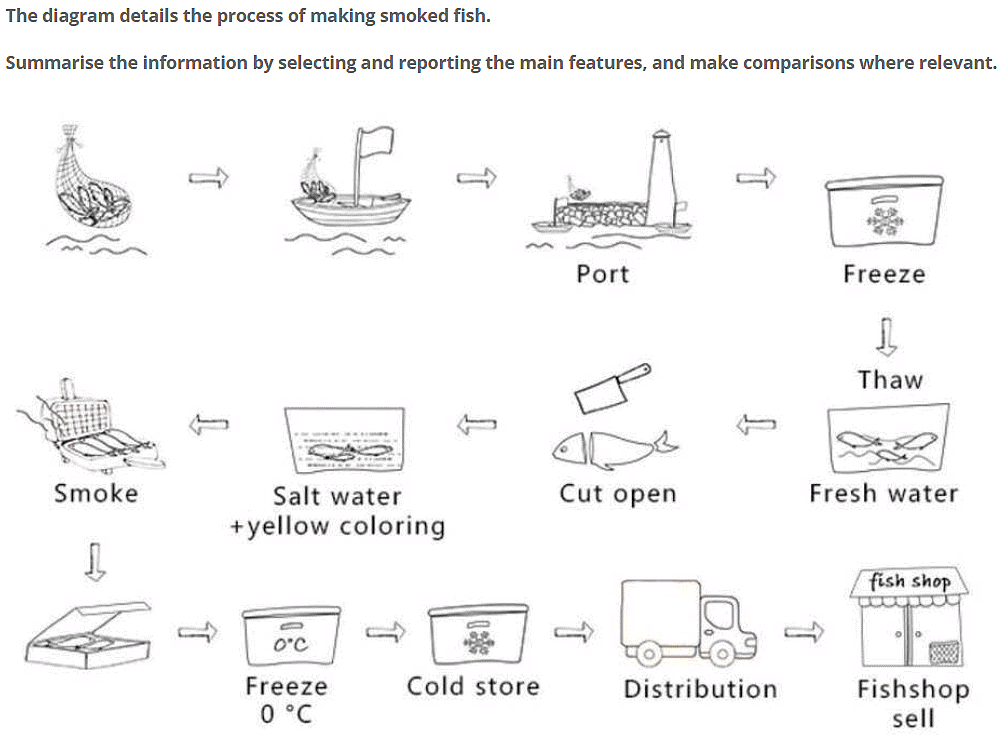
5. Process Diagram
You may be presented with a visual representation of a process, such as a diagram, flowchart or cycle diagram, and you will be required to describe the stages of the process in your own words. In the process diagram, then you will need to analyze and interpret the information presented and write a report summarizing the key features of the diagram, including any important stages, materials used, or changes that occur throughout the process.
Example:
6. Map
In map type Questions, you will need to analyze and interpret the information presented and write a report summarizing the key features of the map, including any landmarks, geographical features, or changes in the area depicted. There are three main types of map questions:
- Describe one map in the present day.
- Describe two maps- one in the present and one in the future.
- Describe two maps- one in the past and one in the present.
Example:

7. Multiple Graphs
Multiple graph type questions refer to tasks where you are given more than one graph or chart to analyze and describe. Here are some examples of multiple graph type questions:- Line graph and table:You may be presented with a line graph showing a trend over time and a table with specific data points related to the trend. You will need to analyze both the line graph and the table, and then present a summary of the key features and trends.
- Bar chart and pie chart:A bar chart may show the distribution of a certain variable across different categories, while a pie chart could display the percentage contribution of each category to a whole. You will need to compare and contrast the information from both charts and summarize the key points.
- Flowchart and diagram: You might be given a flowchart illustrating a process, and a diagram showing the components of a system or object. In this case, you need to describe the process in the flowchart and explain how the different components in the diagram are related to the process.
- Map and table:A map may show the geographical distribution of a certain variable, while a table provides specific data points or statistics for different locations. You will need to analyze and describe the information from both the map and the table, and present a summary of the key findings.
- Combination of multiple charts:Sometimes, you may be given a combination of different graphs, such as a line graph, bar chart, and pie chart, all related to the same topic. In this case, you will need to analyze and describe the key features and trends from all the graphs, and provide a coherent summary of the overall information.
In all these cases, it's important to identify the main trends, patterns, or features in the graphs and charts, and present a clear and organized summary of the information. Make sure to use appropriate vocabulary, grammar, and structure in your response.
How to Answer IELTS Writing Task 1 Question?

Tip 1: Read the task carefully and take notes
Before you start writing your response, make sure you take a few moments to carefully read the question or task. It will help you better prepare your answers.
Don’t forget to:
- Take notes and write down ideas you think might be suitable for your answer
- Highlight keywords in the task or question to better understand what you need to address in your response
- Do a quick outline to organise your thoughts in response to each
- Expand on your ideas with examples, supporting details, etc.
Tip 2: Break your ideas into paragraphs
Once you have chosen your ideas, it is time to start writing. To keep your answers well organized, you must write in paragraphs. Each paragraph should contain a clear topic that is developed within the paragraph.
Make sure you do not write in bullet points or in point form.
Tips 3: Use the correct format in your response
In Academic, Writing Task 1, when describing a graph, chart or diagram in the question, make sure you have:
- An introduction - rewording of the question
- Body paragraph(s) - key details, their relevance, comparisons, etc.
- An overview or summary of the main ideas.
Tip 4: Use cohesive devices to keep your writing organized
Cohesive devices help you connect your ideas and help keep your writing responses organized. Use these words and phrases to connect your ideas and help your reader follow your writing.
Some cohesive devices you could use, include:
- Furthermore
- However
- Next
- First, second, third
- Finally
- So
- Then
- In addition
Writing Task 1 Example with Detailed Guidelines
The line graph below shows changes in the amount and type of fast food consumed by Australian teenagers from 1975 to 2000. Summarize the information by selecting and reporting the main features and make comparisons where relevant.

Introduce the Graph
You need to begin with one or two sentences that state what the IELTS writing task 1 shows. To do this, paraphrase the title of the graph, making sure you put in a time frame if there is one.
Here is an example of the above line graph:
The line graph compares the fast food consumption of teenagers in Australia between 1975 and 2000, a period of 25 years.
Give an Overview
You also need to state what the main trend or trends in the graph are. Don’t give details such as data here – you are just looking for something that describes what is happening overall. One thing that stands out in this graph is that one type of fast food fell over the period, whilst the other two increased, so this would be a good overview.
Here is an example:
Overall, the consumption of fish and chips declined over the period, whereas the amount of pizza and hamburgers that were eaten increased.
This covers the main changes that took place over the whole period. You may sometimes see this overview as a conclusion. It does not matter if you put it in the conclusion or the introduction when you do an IELTS writing task 1, but you should provide an overview in one of these places.
Give the Detail
- You can now give more specific detail in the body paragraphs.
- When you give the detail in your body paragraphs in your IELTS writing task 1, you must make reference to the data.
- The key to organizing your body paragraphs for an IELTS writing task 1 is to group data together where there are patterns.
- To do this you need to identify any similarities and differences.
- Look at the graph – what things are similar and what things are different?
- As we have already identified in the overview, the consumption of fish and chips declined over the period, whereas the amount of pizza and hamburgers that were eaten increased.
- So it is clear that pizza and hamburgers were following a similar pattern, but fish and chips were different. On this basis, you can use these as your ‘groups’, and focus one paragraph on fish and chip and the other one on pizza and hamburgers.
Here is an example of the first paragraph:
In 1975, the most popular fast food with Australian teenagers was fish and chips, being eaten 100 times a year. This was far higher than Pizza and hamburgers, which were consumed approximately 5 times a year. However, apart from a brief rise again from 1980 to 1985, the consumption of fish and chips gradually declined over the 25 year timescale to finish at just under 40.
As you can see, the focus is on fish and chips. This does not mean you should not mention the other two foods, as you should still make comparisons of the data as the questions asks.
The second body then focuses on the other foods:
In sharp contrast to this, teenagers ate the other two fast foods at much higher levels. Pizza consumption increased gradually until it overtook the consumption of fish and chips in 1990. It then levelled off from 1995 to 2000. The biggest rise was seen in hamburgers as the occasions they were eaten increased sharply throughout the 1970’s and 1980’s, exceeding that of fish and chips in 1985. It finished at the same level that fish and chips began, with consumption at 100 times a year.
|
30 videos|178 docs|17 tests
|
FAQs on How to attempt the Writing Task 1 - Writing for Academic IELTS
| 1. What is IELTS Writing Task 1 and what does it involve? |  |
| 2. How much time should I spend on IELTS Writing Task 1? | |
| 3. What are common types of visual data presented in IELTS Writing Task 1? | |
| 4. How is IELTS Writing Task 1 scored? | |
| 5. Can I use bullet points or lists in my IELTS Writing Task 1 response? | |


mock tests for examination
,Free
,past year papers
,Sample Paper
,Exam
,How to attempt the Writing Task 1 | Writing for Academic IELTS
,Important questions
,Summary
,How to attempt the Writing Task 1 | Writing for Academic IELTS
,MCQs
,video lectures
,practice quizzes
,shortcuts and tricks
,ppt
,Semester Notes
,Objective type Questions
,Previous Year Questions with Solutions
,study material
,How to attempt the Writing Task 1 | Writing for Academic IELTS
,Viva Questions
,Extra Questions
,


How to attempt the Writing Task 1 Free PDF Download
Importance of How to attempt the Writing Task 1
How to attempt the Writing Task 1 Notes
How to attempt the Writing Task 1 IELTS Questions
Study How to attempt the Writing Task 1 on the App
|
© EduRev
|
Education Revolution
|


|


