IELTS Exam > IELTS Notes > Writing for Academic > Solved Example: Pie Chart - 6
Solved Example: Pie Chart - 6

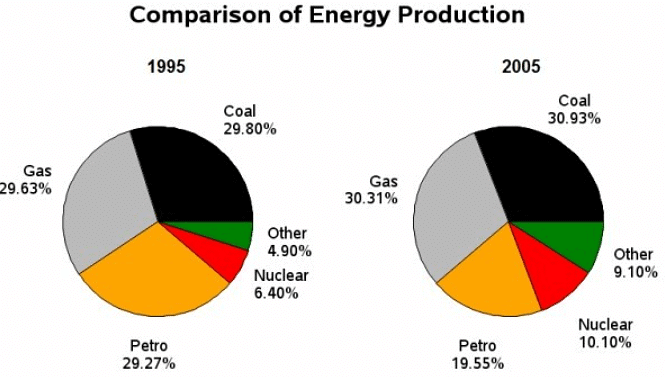
Q. The pie charts below show the comparison of different kinds of energy production of France in two years.
Sample Answer:
- The two pie charts compare the proportion of five types of energy production by the different sources in France in 1995 and 2005.Overall, the major sources of energy were gas and coal in both the years while nuclear and other kinds of energy sources generated the minimum amount of energy in France.
- Petrol was the only source which reduced in the last year. It is clear from the graph the graph, in 1995, energy produced by coal comprised of 29.80% and experienced a very slight increase of about 1% in 2005.Likewise, in the first year , gas generated 29.63% which rose marginally to 30.1% in the last year.
- With regards to nuclear power and other sources, there was an approximate of 5% increase in the energy production and reached to 10.10% and 9.10% respectively. On the other hand, petrol was the only source which went down from 29.27% in 1995 to 19.55% in 2005.
The document Solved Example: Pie Chart - 6 is a part of the IELTS Course Writing for Academic IELTS.
All you need of IELTS at this link: IELTS
About this Document

4.91/5 Rating

Apr 18, 2026 Last updated
Document Description: Solved Example: Pie Chart - 6 for IELTS 2026 is part of Writing for Academic IELTS preparation. The notes and questions for Solved Example: Pie Chart - 6 have been prepared according to the IELTS exam syllabus. Information about Solved Example: Pie Chart - 6 covers topics like and Solved Example: Pie Chart - 6 Example, for IELTS 2026 Exam. Find important definitions, questions, notes, meanings, examples, exercises and tests below for Solved Example: Pie Chart - 6.
Introduction of Solved Example: Pie Chart - 6 in English is available as part of our Writing for Academic IELTS for IELTS & Solved Example: Pie Chart - 6 in Hindi for Writing for Academic IELTS course. Download more important topics related with notes, lectures and mock test series for IELTS Exam by signing up for free. IELTS: Solved Example: Pie Chart - 6
Description
Solved Example: Pie Chart of Writing covers all the important topics, helping you prepare for the IELTS exam on EduRev. Start for free!
Information about Solved Example: Pie Chart - 6
In this doc you can find the meaning of Solved Example: Pie Chart - 6 defined & explained in the simplest way possible. Besides explaining types of Solved Example: Pie Chart - 6 theory, EduRev gives you an ample number of questions to practice Solved Example: Pie Chart - 6 tests, examples and also practice IELTS tests


Related Searches
Exam, Solved Example: Pie Chart - 6, Important questions, Solved Example: Pie Chart - 6, Extra Questions, Free, past year papers, Semester Notes, Viva Questions, MCQs, ppt, shortcuts and tricks, Summary, pdf , Objective type Questions, mock tests for examination, practice quizzes, Sample Paper, Solved Example: Pie Chart - 6, Previous Year Questions with Solutions, video lectures, study material;